Confidential client deliverable · Enter the passcode you were given
Imagine Wireless · Powered by OoklaConfidential
LGA · Rev 1 Baseline
Venue Network Intelligence Report · Rev 1 · First issue
Network baseline for LaGuardia Airport across Terminals A, B, and C
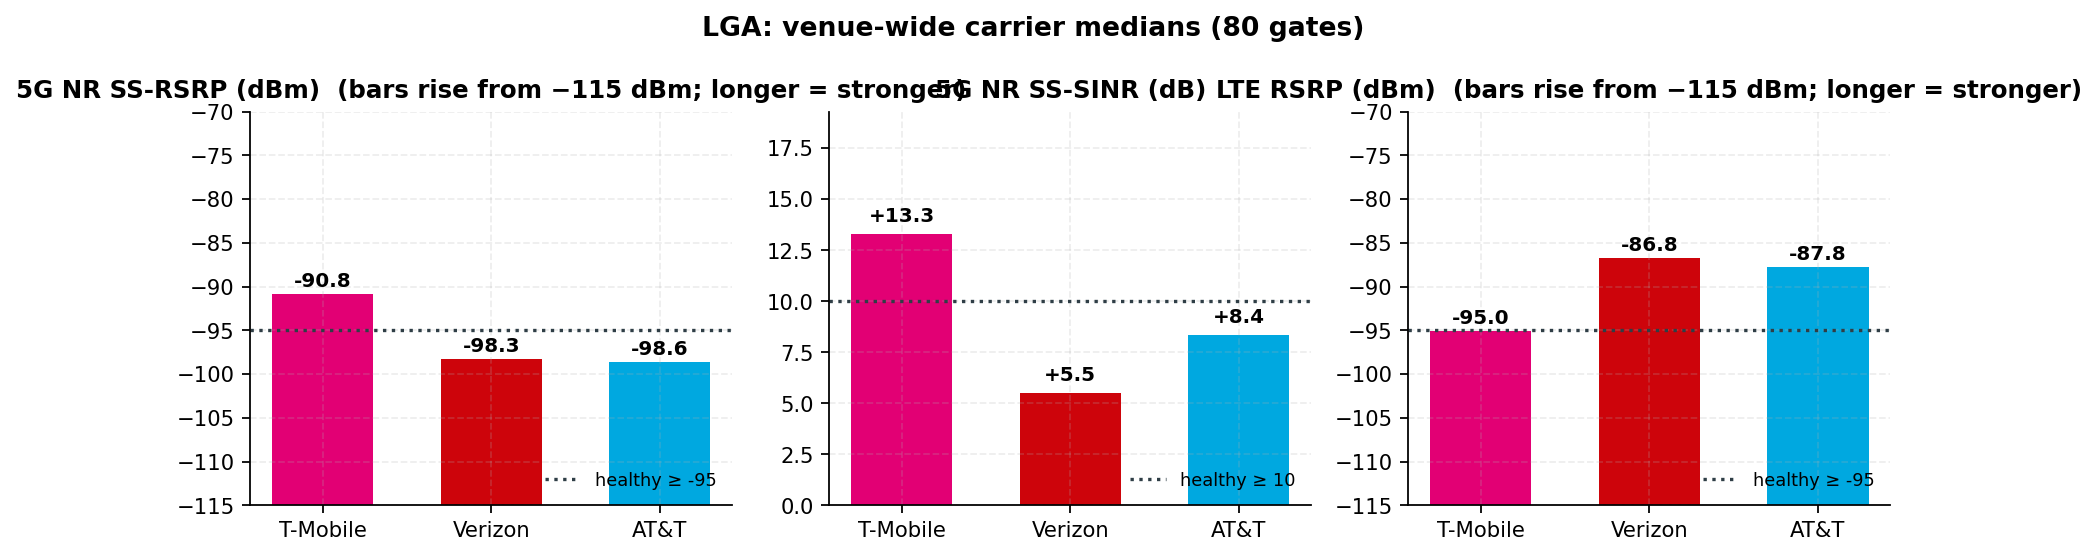
T-Mobile leads 5G at the gates: healthy at 56 of 80 gates and the strongest 5G carrier at
76 of 80. Verizon and AT&T tie at a 5G gate median below the healthy line (−98.3 and −98.6 dBm,
0.3 dB apart) while both carry healthy LTE at 77 and 75 of 80 gates. Boingo Wireless is the Port Authority's neutral-host cellular (DAS) and Wi-Fi provider at LGA under the agreement announced October 14, 2025 (2026 to 2038, option to 2043; Boingo has operated the Port Authority's airport wireless since the 1999 New York Telecom Partners agreement).
80
Gates measured · Terminal A 6 · Terminal B 36 · Terminal C 38
Gate-carrier pairs below the critical line (−110 dBm)
58.6%
Terminal-zone Wi-Fi offload · of observed MB on tiles assigned to a terminal zone (n=15,326) · 60.9% over the whole clip (n=16,970)
Prepared by the Imagine Wireless Network Intelligence Platform · Powered by Ookla
Data window 2025-09-01 to 2026-08-31 · Issued 2026-09-15 (rev 1) · Freshness 15 days at issue
Prepared for Port Authority of New York and New Jersey stakeholder review
Confidential
Section 1
Executive readout
Carrier order · baseline purpose
T-Mobile leads 5G at the gates and in Terminal B and Terminal C; Terminal A is a three-way tie. Verizon is the LTE network of record,
with a 5G layer that does not reach the gates. AT&T is tied with Verizon at the 5G gate median, with
the smallest 5G footprint. No gate is critical for any carrier: 0 of 240 gate-carrier pairs measure
below −110 dBm.
−90.8 dBm
T-Mobile gate median 5G RSRP · healthy at 56 of 80 gates (70.0%) · 14 gates within 1 dB of the line · at risk at 24
−98.3 dBm
Verizon gate median 5G RSRP · healthy at 6 of 80 gates (7.5%) · 11 gates within 1 dB of the line · at risk at 74
−98.6 dBm
AT&T gate median 5G RSRP · healthy at 14 of 80 gates (17.5%) · 11 gates within 1 dB of the line · at risk at 66
LaGuardia Airport is operated by the Port Authority of New York and New Jersey (PANYNJ). Terminal B
is operated by LaGuardia Gateway Partners (Vantage Group and Meridiam) under a public-private lease with
PANYNJ and Terminal C by Delta Air Lines under a lease with PANYNJ cited.
This report is a baseline of the terminal area as measured in the window. It measures 80 gates, 108
mapped venue points, 34,844 radio-frequency (RF) tiles, and 16,970 usage tiles over the 12-month window
ending 2026-08-31.
T-Mobile
Leads 5G at the gates and in Terminal B and Terminal C; Terminal A is a three-way tie. T-Mobile holds
healthy 5G reference signal received power (RSRP) at 56 of 80 gates (70.0%; 14 gates within 1 dB of the
line). Its venue gate median is −90.8 dBm, 7.5 dB ahead of Verizon and 7.8 dB ahead of AT&T. It is
the strongest 5G carrier at 76 of 80 gates (Terminal A 6 of 6, Terminal B 32 of 36, Terminal C 38 of 38,
counts) and reports 5G on 91% of its on-airport tiles, the widest footprint of the three. Its signal
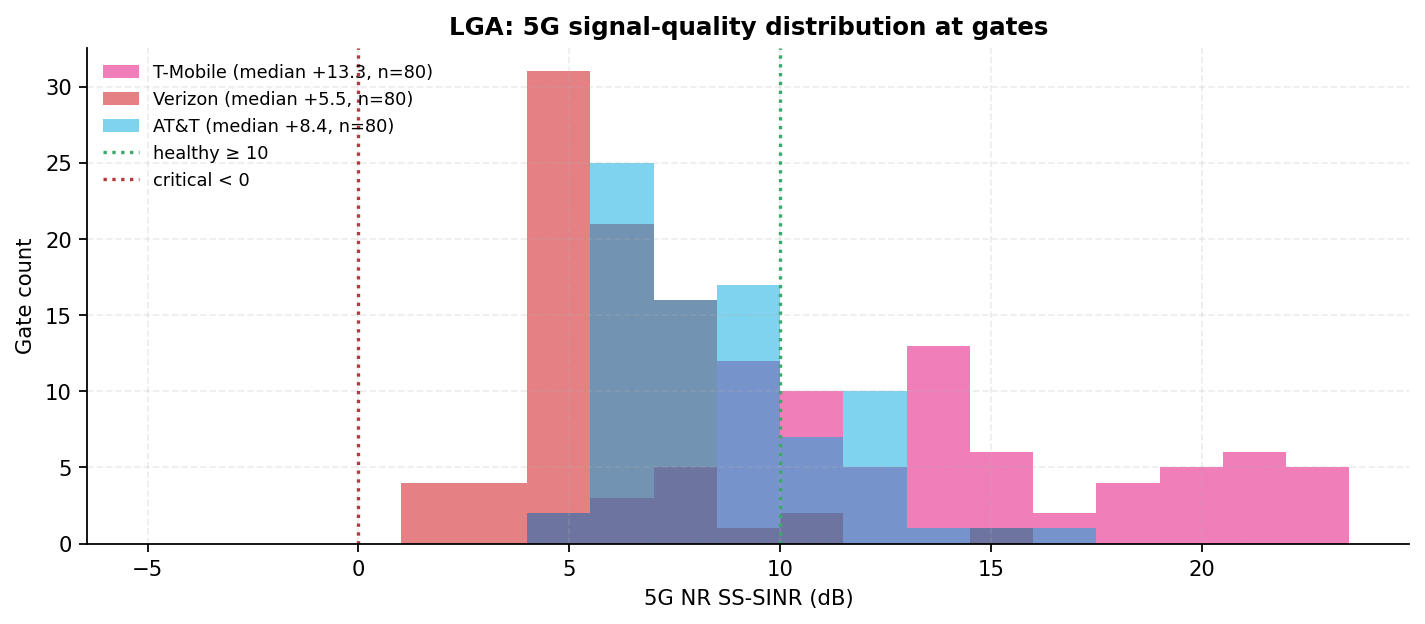
quality median is +13.3 dB (58 of 80 gates healthy). On the tile basis it leads Terminal B and Terminal C;
Terminal A (Marine Air Terminal) is a three-way tie (medians −98.0, −98.0, −98.0 dBm; healthy shares 39%,
38%, 38%), and it is T-Mobile's lowest zone. Its LTE layer is the weakest of the three (gate median
−95.0 dBm, 40 of 80 gates healthy).
Verizon
The LTE network of record, with a 5G layer that does not reach the gates. Verizon is the strongest
LTE carrier at 56 of 80 gates with an LTE gate median of −86.8 dBm (77 of 80 gates healthy). Its 5G gate
median is −98.3 dBm, 3.3 dB below the healthy line, with 6 of 80 gates (7.5%; 11 gates within 1 dB
of the line) healthy and a 5G signal-quality median of +5.5 dB (3 of 80 gates healthy), the lowest of the three. Verizon is the weakest
carrier at 41 of 80 ranked asymmetry gates. Its weakest zone on the tile basis is Terminal B (32% of
tiles healthy); its strongest is Terminal C (58%).
AT&T
Tied with Verizon at the 5G gate median, with the smallest 5G footprint. AT&T's 5G gate median is
−98.6 dBm, 0.3 dB from Verizon's and inside the 1 dB noise floor, so the two are reported as tied at
the gate median. 14 of 80 gates (17.5%; 11 gates within 1 dB of the line) are healthy, 66 are at risk, and
0 are critical. AT&T reports 5G on 59%
of its on-airport tiles, the smallest footprint; the other 41% carry LTE only. Its LTE layer is healthy
(gate median −87.8 dBm, 75 of 80 gates). On the tile basis AT&T is ahead of Verizon in Terminal B and
Terminal C (Terminal A 38% vs 38%, Terminal B 58% vs 32%, Terminal C 70% vs 58%). AT&T is the weakest
carrier at 35 of 80 ranked asymmetry gates.
Per terminal, for the two trailing carriers
Terminal C gate medians: T-Mobile −84.8, Verizon −98.8, AT&T −101.3 dBm (n=38 gates). AT&T trails
Verizon by 2.5 dB on the Terminal C gate median, and across gates 81 to 89B its per-gate means run −105.2
to −101.4 dBm (n=11 gates), within 8.6 dB or less of the critical line. Terminal B gate medians: T-Mobile
−93.2, AT&T −96.3, Verizon −97.3 dBm (n=36 gates), with healthy 5G at 12 of 36 gates (33%) for AT&T
against 4 of 36 gates (11%) for Verizon: in Terminal B the order of the two trailing carriers flips,
AT&T ahead of Verizon.
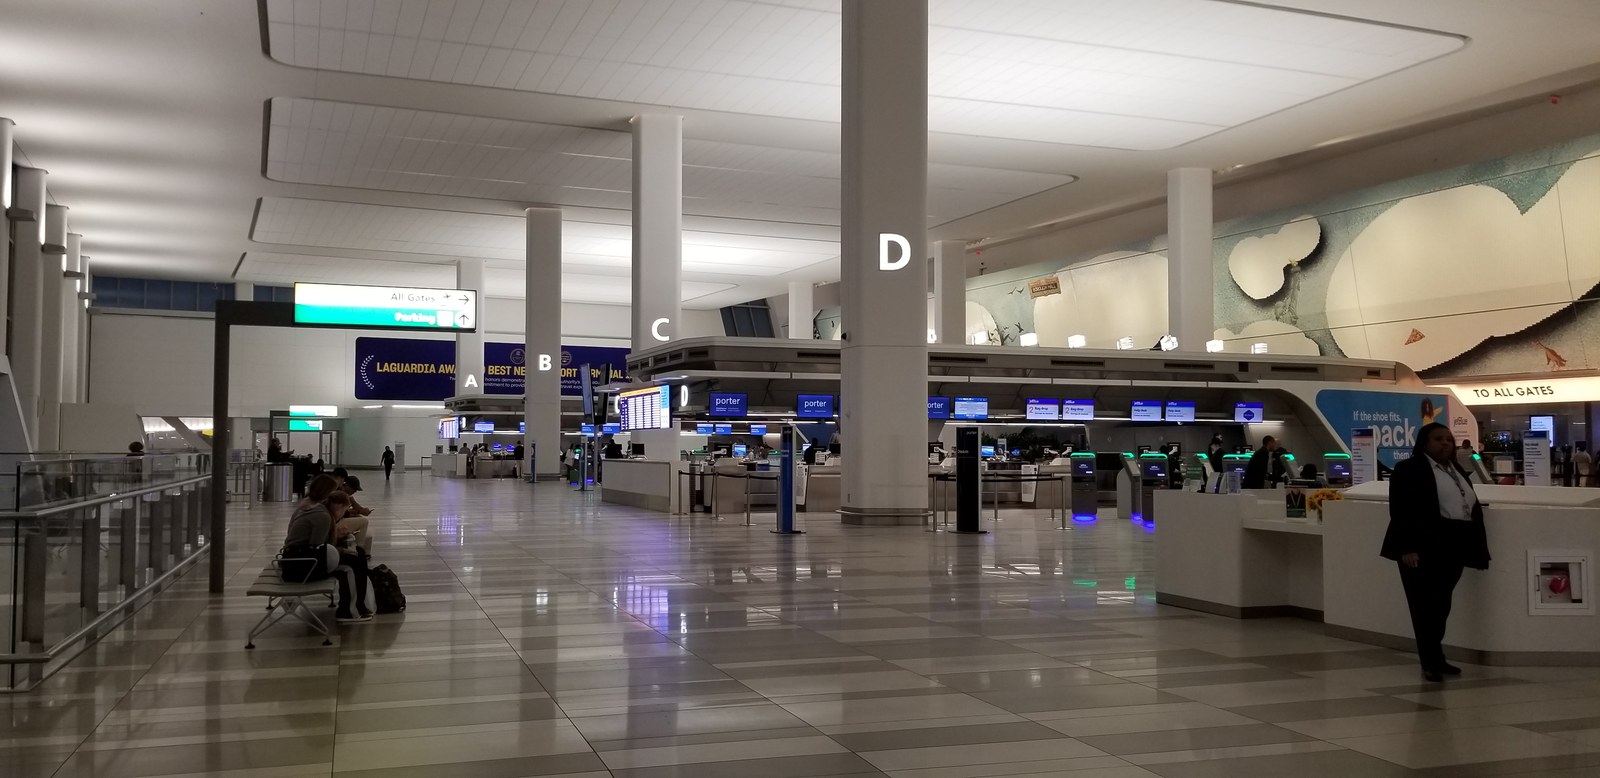
Photo · Terminal B Level 3 ticketing and check-in hall, October 2025Wikimedia Commons
Terminal B Level 3 ticketing and check-in hall, October 2025. Photo: Silver Dovelet, CC BY-SA 4.0, via Wikimedia Commons. Illustrative, resized only.
How the order holds
Gate-median order: T-Mobile, then Verizon and AT&T. T-Mobile's margin is 7.5 dB over Verizon and
7.8 dB over AT&T, with T-Mobile healthy at 56 of 80 gates against 6 and 14. The Verizon-to-AT&T
margin is 0.3 dB, under the 1 dB noise floor set in section 16, so Verizon and AT&T are tied at the gate
median and this report never ranks one above the other on that figure. Verizon is listed second only
because its median is numerically higher. The order reproduces from the tile export alone.
Why the baseline matters
Boingo Wireless is the Port Authority's neutral-host cellular (DAS) and Wi-Fi provider at LGA under the agreement announced October 14, 2025 (2026 to 2038, option to 2043; Boingo has operated the Port Authority's airport wireless since the 1999 New York Telecom Partners agreement). Boingo's Terminal B neutral-host DAS and Wi-Fi system was designed for the headhouse and the 18-gate eastern concourse (engineering-firm design record; the Western Concourse is not stated in that record), and the reconciled Airport DAS Master (2026-07-28) records the same arrangement and adds its shape: DAS yes, self-owned no, neutral host yes, contract 2026 to 2038 with a 10+3 term structure, awarded through an RFP in 2025, alongside an active Boingo Passpoint deployment Imagine knowledge graph. The 2026 to 2035 Port Authority capital plan (approved December 2025) funds a rebuild of the non-landmarked gate areas of the Marine Air Terminal; the dollar figure and schedule are not published cited. As Boingo's in-building systems are extended and the Marine Air Terminal is rebuilt, this baseline is the design input and the before reading for section 14.
What the pattern is consistent with (inference)
Band first. Verizon's strongest-serving 5G band is NR3700 (C-band) on 70% of its 4,253 band-reporting 5G
tiles; AT&T's is NR3700 or NR3500 on 87% of 319 (a small cell-resolved sample, section 9.1); T-Mobile's
is NR2500 or NR1900 on 75% of 12,120. Strong LTE with weak C-band 5G over the same buildings (Verizon and
AT&T LTE healthy at 77 and 75 of 80 gates; their 5G at 6 and 14) is the expected macro propagation
picture for a large building: 3.5 to 3.7 GHz penetrates less than the 1.9 to 2.5 GHz that carries
T-Mobile's 5G, which is healthy over 95% of the Terminal B headhouse tiles and 86% of the Terminal C
tiles (section 4.7). The second hypothesis, which the Recommendation 1 attestation will test, is
in-building infrastructure that carries LTE for all three carriers but 5G NR for T-Mobile only.
The export cannot separate the two, and this report does not state that any carrier is on any
in-building system.
How to read the order
Every ranking in this report is signal-layer: RSRP and signal-to-interference-plus-noise ratio (SINR)
from an Android crowdsource panel. The export contains no throughput or latency, so it measures
where signal is. It does not measure whether a call or app fails, and a strong-signal network can
still be congested. The panel's composition differs by carrier and is Android-only, and handset vintage
decides which devices can report C-band 5G (Verizon, AT&T) versus n41 (T-Mobile) at all, so
cross-carrier comparisons inherit a device-population bias the export cannot correct. Nothing in this
report is measured indoors; gate and tenant values are tiles within 80 m of a point (section 16).
Section 2
Venue snapshot and asset inventory
Operators · gates · in-building record
Provenance legend: measured values compute from the Ookla exports at build time. Facts marked
"cited" come from public records (Port Authority releases and terminal pages, vendor and
design-firm records, FAA statistics, press) and are not measurements. Section 16 defines every
threshold and basis.
Element
Value
Notes
Airport / IATA / ICAO
LaGuardia Airport / LGA / KLGA
FAA large hub; 32,800,000 total passengers in 2025, -2.2% versus 2024 (Port Authority; passengers in both directions, a different basis from the FAA enplanement figure used in section 12) cited
Operating authority
Port Authority of New York and New Jersey (PANYNJ)
Terminal B under a public-private lease to LaGuardia Gateway Partners (Vantage Group and Meridiam); Terminal C under a lease to Delta Air Lines cited
Terminals analyzed
3
Terminal A (Marine Air Terminal): Spirit Airlines was the sole commercial lessee of the six gates until Spirit Airlines ceased all operations on 2026-05-02; the terminal then closed to the public for the rest of the window cited. Terminal B: Air Canada, American Airlines, Frontier Airlines, JetBlue, Porter Airlines, Southwest Airlines, and United Airlines; headhouse plus the Eastern and Western concourses linked by two pedestrian bridges cited. Terminal C: Delta Air Lines (the only airline listed by PANYNJ); the former Terminal D is part of the consolidated Terminal C; four concourses, completed December 2024 cited
Zones for tile assignment
3
Terminal A · Terminal B · Terminal C (nearest gate or tenant point within 500 m)
Gates analyzed
80
Terminal A 6, Terminal B 36, Terminal C 38 (OpenStreetMap inventory pinned 2026-09-15, zoned by terminal footprint). PANYNJ publishes 35 gates at Terminal B (gates 11 to 31 in the Western Concourse, 40 to 59 in the Eastern Concourse) and 37 to 38 gates at Terminal C (gates 60 to 98); the Marine Air Terminal has six gates cited; the OpenStreetMap inventory is used as measured and the delta is disclosed in section 16. The design record's 18-gate eastern concourse corresponds to 19 Eastern Concourse gates in the inventory (gates 40 to 59)
Mapped venue points
108
48 food · 30 retail · 9 other · 9 services · 7 transport_admin · 5 lodging. Zone attribution: A 6, B 58, C 35, outside zones 9. OpenStreetMap capture, pinned 2026-09-15 transcribed points only
Boingo Wireless is the Port Authority's neutral-host cellular (DAS) and Wi-Fi provider at LGA under the agreement announced October 14, 2025 (2026 to 2038, option to 2043; Boingo has operated the Port Authority's airport wireless since the 1999 New York Telecom Partners agreement). Boingo's Terminal B neutral-host DAS and Wi-Fi system was designed for the headhouse and the 18-gate eastern concourse (engineering-firm design record; the Western Concourse is not stated in that record; undated engineering-firm page, project images dated November 2022). The reconciled Airport DAS Master (2026-07-28) records the same arrangement and adds its shape: DAS yes, self-owned no, neutral host yes, contract 2026 to 2038 with a 10+3 term structure, awarded through an RFP in 2025, alongside an active Boingo Passpoint deployment Imagine knowledge graph. Per-building carrier loading is the Recommendation 1 attestation
Knowledge-graph coverage
Profile, Boingo deployments, capital-plan and benchmark evidence
Profile: large hub, 16,278,532 enplanements (year not recorded in the graph; the FAA calendar-2024 figure in section 12 is a different record and the two are never presented as the same quantity). Deployments: Boingo Wireless Passpoint; Boingo Wireless DAS. Contracts query not available. No LGA-specific vendor rows beyond Boingo Wireless Imagine knowledge graph
Public Wi-Fi
SSID _Free LGA WiFi
Free; Boingo Wireless operates it under the Port Authority agreement
Capital program
The $8 billion LaGuardia redevelopment (two public-private terminal programs)
Terminal B completed January 2022; Terminal C headhouse opened June 2022 and its consolidation was completed December 2024; the 2026 to 2035 Port Authority capital plan (approved December 2025) funds a rebuild of the non-landmarked gate areas of the Marine Air Terminal; the dollar figure and schedule are not published; the AirTrain LGA project was cancelled in March 2023; a $160 million LaGuardia Link Q70 bus upgrade was announced in March 2025 with an on-airport stop near Terminal C cited
Recognition
Airports Council International ASQ 2025 best North American airport in the 25 to 40 million passenger class (third consecutive year); Skytrax best airport in North America 2025; Terminal B Skytrax 5-Star rating (2023 and 2025)
Context only cited
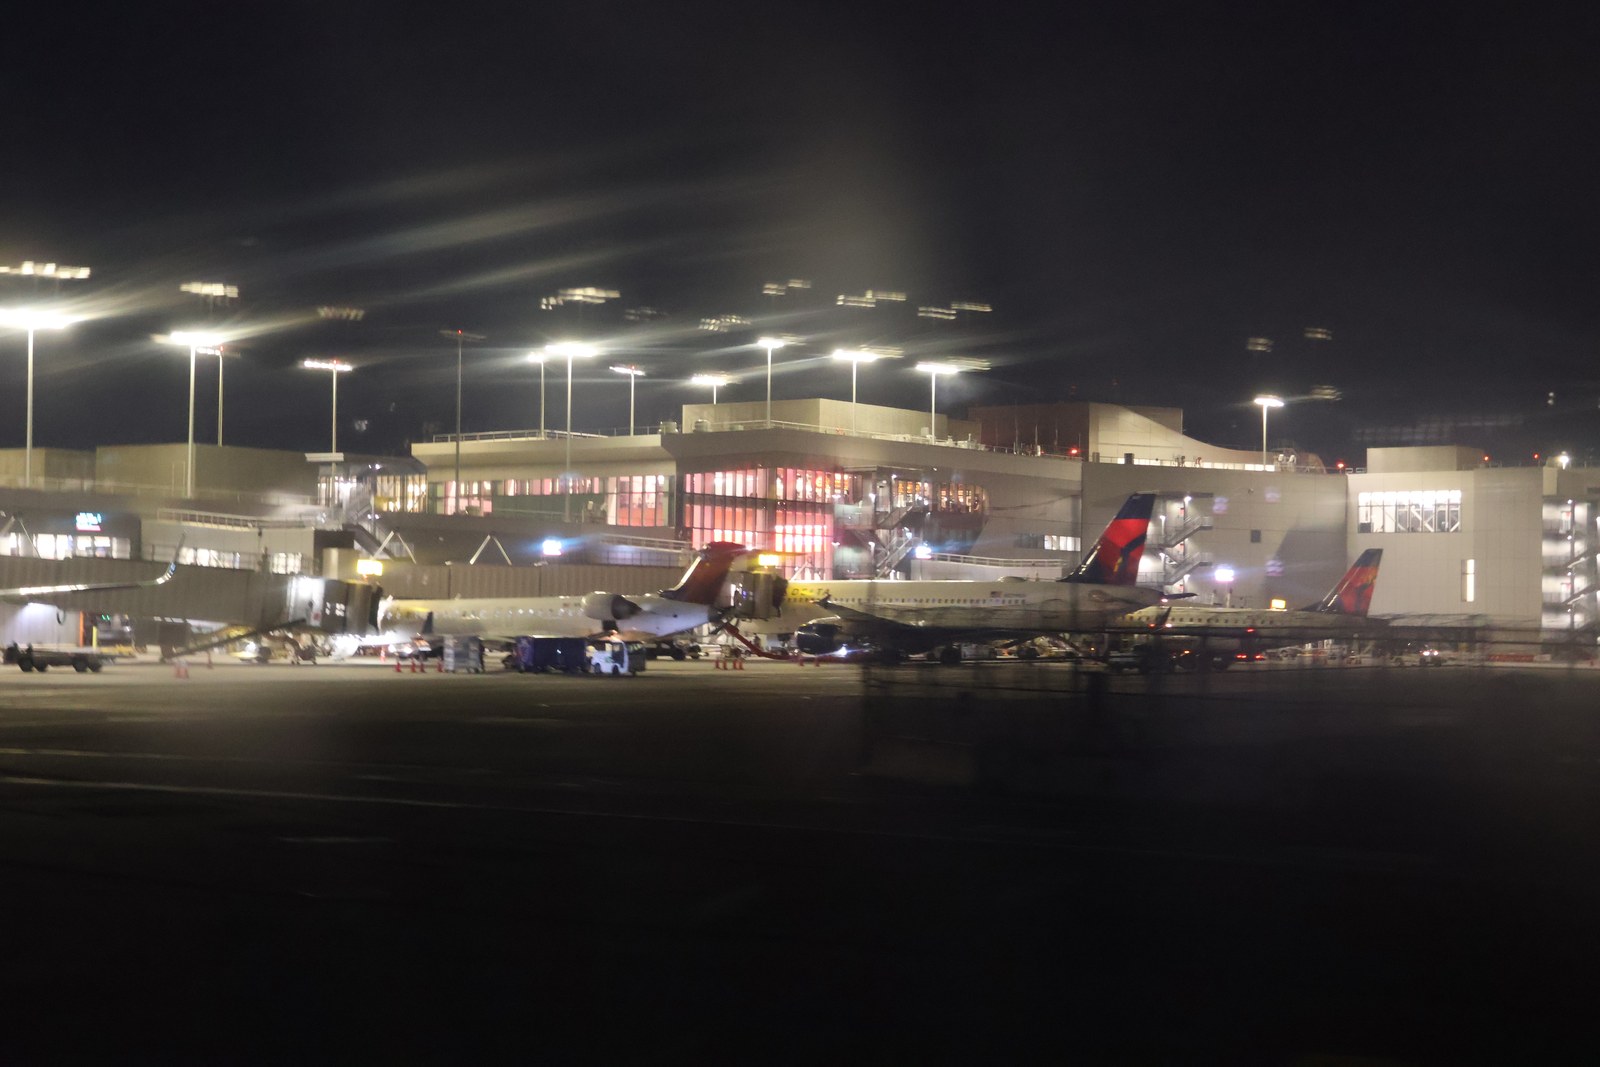
Photo · Apron-level night view of the Terminal C concourse, October 2023Wikimedia Commons
Apron-level night view of the Terminal C concourse from a taxiing aircraft, October 2023. Illustrative only. Photo: DiscoA340, CC BY-SA 4.0, via Wikimedia Commons. Resized only.
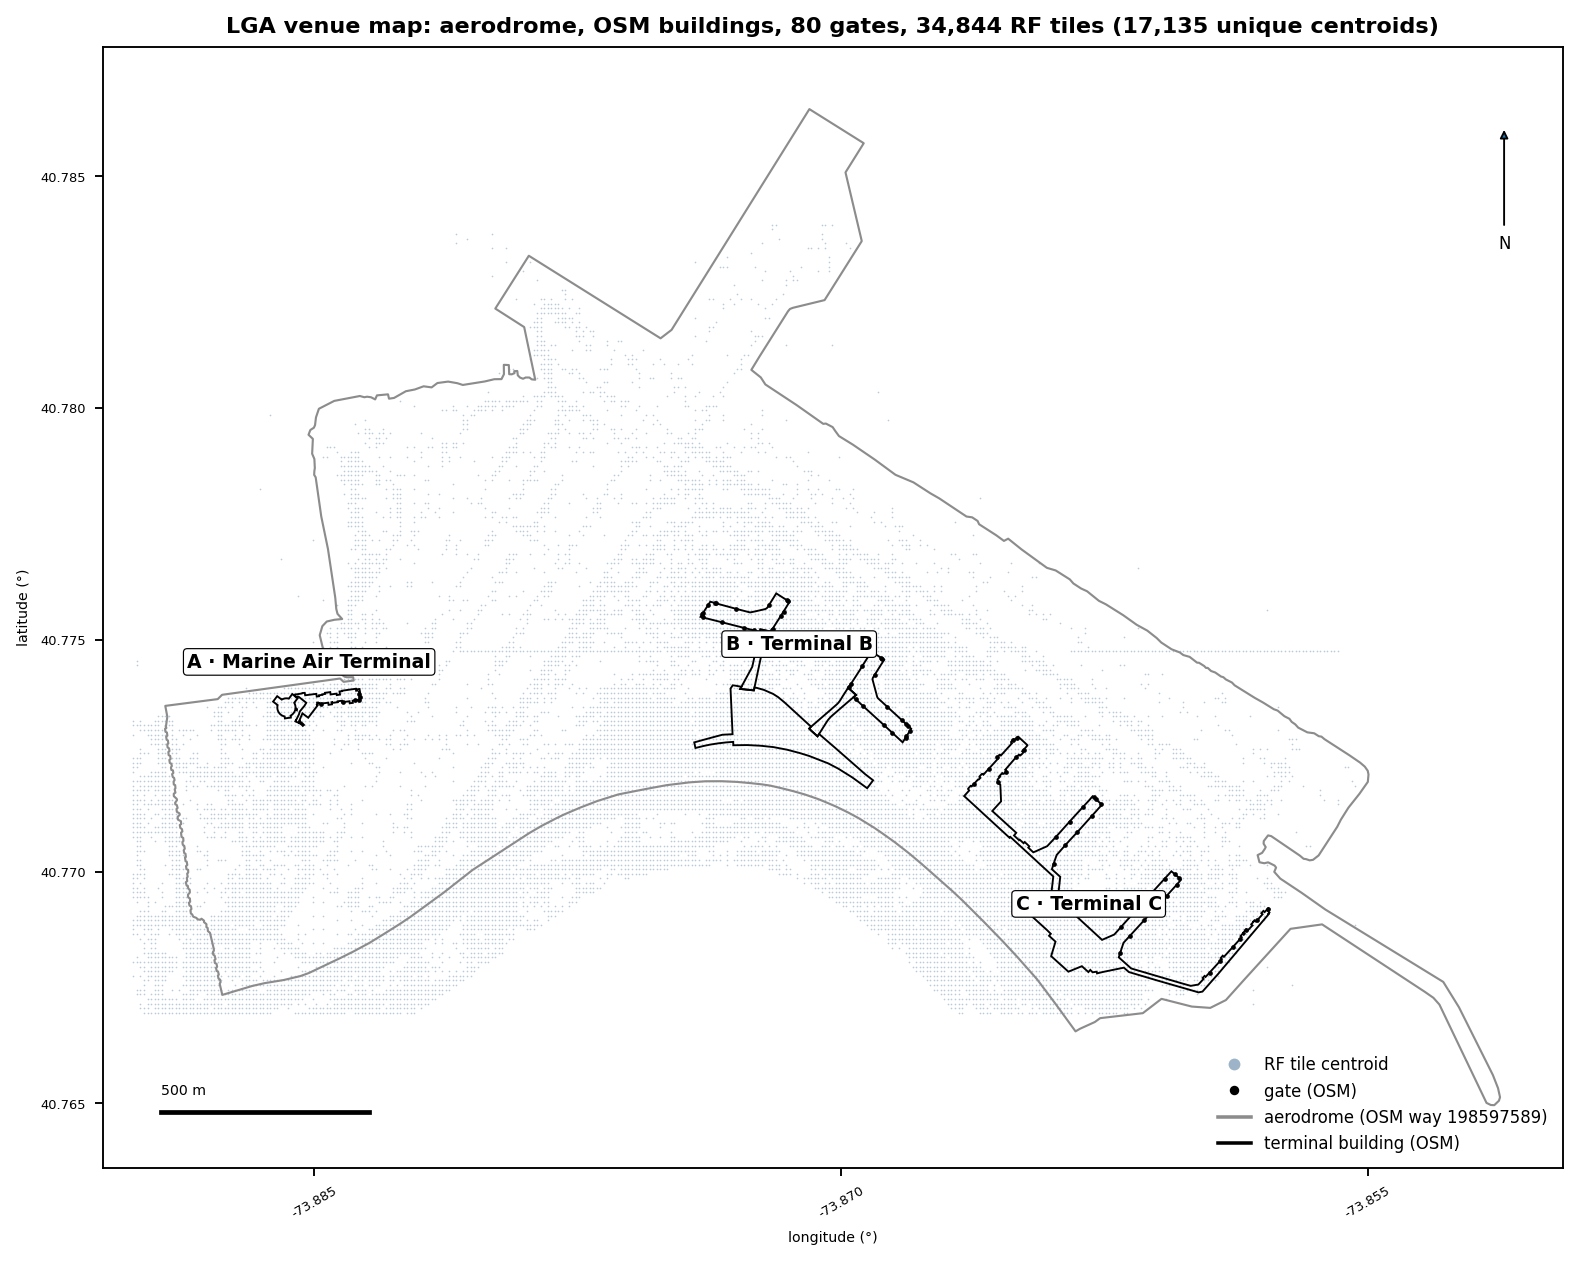
Venue map: aerodrome outline, OSM terminal buildings, 80 gates, and the 34,844 on-airport RF tile centroids. North up; scale bar in meters. Source: Ookla Cell Analytics per-carrier RF tile export, 2025-09-01 to 2026-08-31.
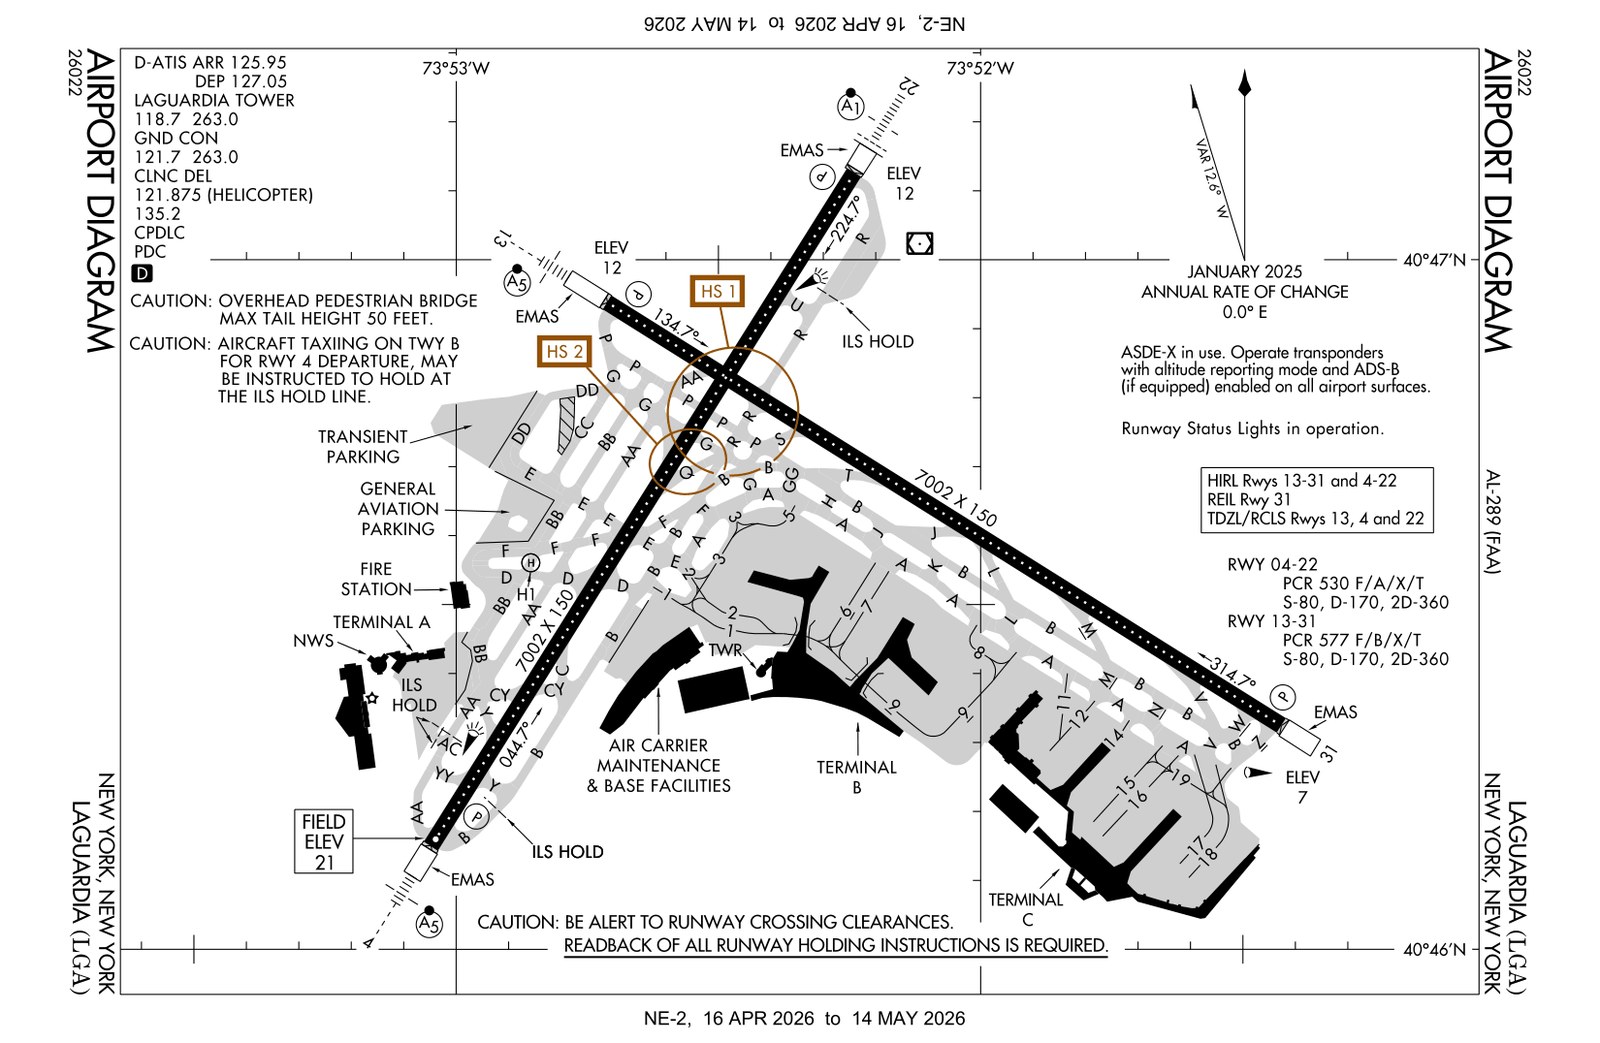
Diagram · FAA airport diagram for LGA, January 2025 editionWikimedia Commons
Photo: Federal Aviation Administration, Public domain, via Wikimedia Commons. Reproduced for orientation. It is the FAA's drawing, not this report's geometry; runway and taxiway labels come from the FAA.
Every cellular number in this report is an aggregate of crowdsourced background scans from consumer
Android devices (about 3% of handsets; iOS devices are not sampled), binned by Ookla to map tiles of about
8 m by 11 m, then joined to gate and tenant points. The numbers describe where devices were over a
12-month window. They are not drive-test measurements. Every n counts tiles, and every table carries its
n so thin cells are visible.
3.0 Carrier summary
Carrier
5G RSRP median
5G SINR median
LTE RSRP median
Healthy 5G gates
n (gates / RF tiles)
T-Mobile
−90.8 dBm
+13.3 dB
−95.0 dBm
56 of 80
80 / 14,024
Verizon
−98.3 dBm
+5.5 dB
−86.8 dBm
6 of 80
80 / 11,138
AT&T
−98.6 dBm
+8.4 dB
−87.8 dBm
14 of 80
80 / 9,682
Healthy = gate mean ≥ −95 dBm. SINR healthy (≥ 10 dB): T-Mobile 58, AT&T 20, Verizon 3 of 80 gates.
LTE healthy gates: Verizon 77, AT&T 75, T-Mobile 40 of 80. Strongest LTE reading: Verizon 56, AT&T 24, T-Mobile 0 gates. Full per-gate tables ship in the PDF appendices.
5G footprint and conditional medians (tile basis). Each 5G median is conditional on the tile reporting
a 5G reading; the last column combines presence and level.
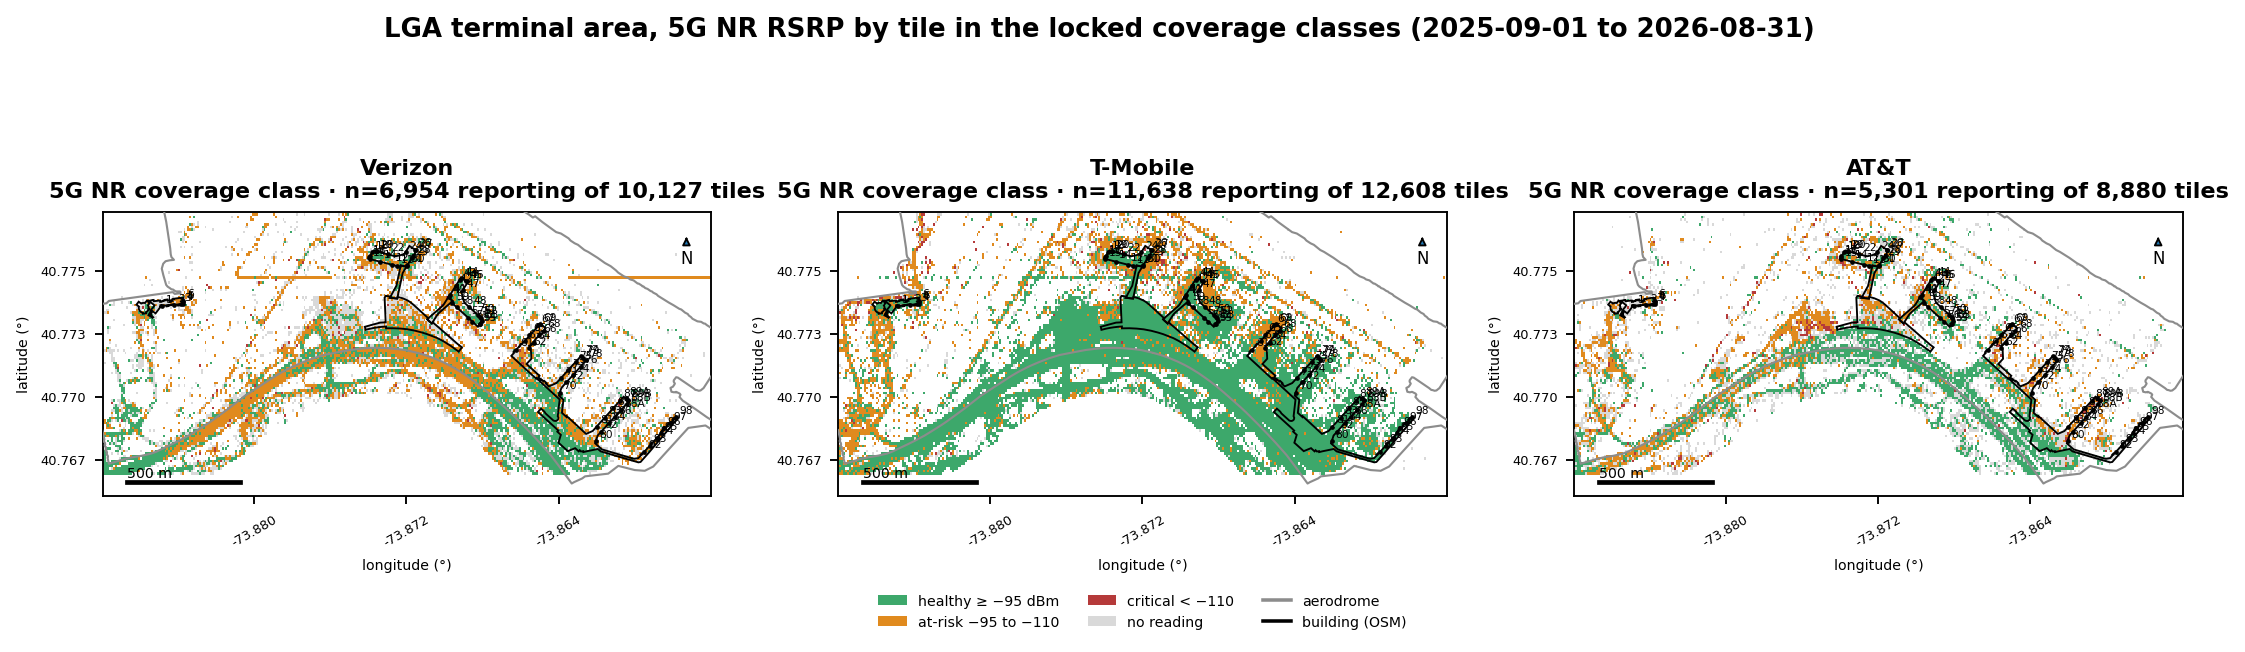
Fig. 4 · 5G NR RSRP by tile and carrier · terminal area · locked coverage classSource · Ookla
Terminal-area map of 5G NR RSRP by tile and carrier, colored by the locked coverage class. Grey tiles carry no 5G reading. Each tile is about 8 m by 11 m; n is the tile count per panel. Source: Ookla Cell Analytics per-carrier RF tile export, 2025-09-01 to 2026-08-31.
Framed findings
T-Mobile framed finding
Gate-median rank 1 of 3 on 5G, 7.5 dB ahead of Verizon and 7.8 dB ahead of AT&T; first on 5G reach;
leads Terminals B and C on the tile basis with Terminal A a three-way tie; weakest on LTE. This is the
parity bar any in-building system must hold for T-Mobile while it lifts Verizon and AT&T 5G.
Verizon framed finding
Gate-median rank 2 of 3 on 5G only by 0.3 dB over AT&T, inside the noise floor, so tied with AT&T;
first on LTE at 56 of 80 gates. The 5G gap is the largest at the Terminal B headhouse and Terminal C
footprints, where its LTE is healthy. Verizon 5G NR onto Boingo's in-building systems is the
first lift section 13 names, subject to the Recommendation 1 attestation.
AT&T framed finding
Tied with Verizon at the 5G gate median (0.3 dB apart), 7.8 dB behind T-Mobile, with the smallest 5G
footprint (59%) and a healthy LTE layer. AT&T 5G NR onto Boingo's in-building systems is the
second lift section 13 names, and section 14 monitors both Verizon and AT&T first.
3.1 T-Mobile results
T-Mobile delivers the strongest 5G at the gates: 56 of 80 gates (70.0%; 14 gates within 1 dB of the
line) in the healthy band, a venue gate
median of −90.8 dBm, and the strongest 5G reading at 76 of 80 gates. SINR is +13.3 dB at the median (58 of
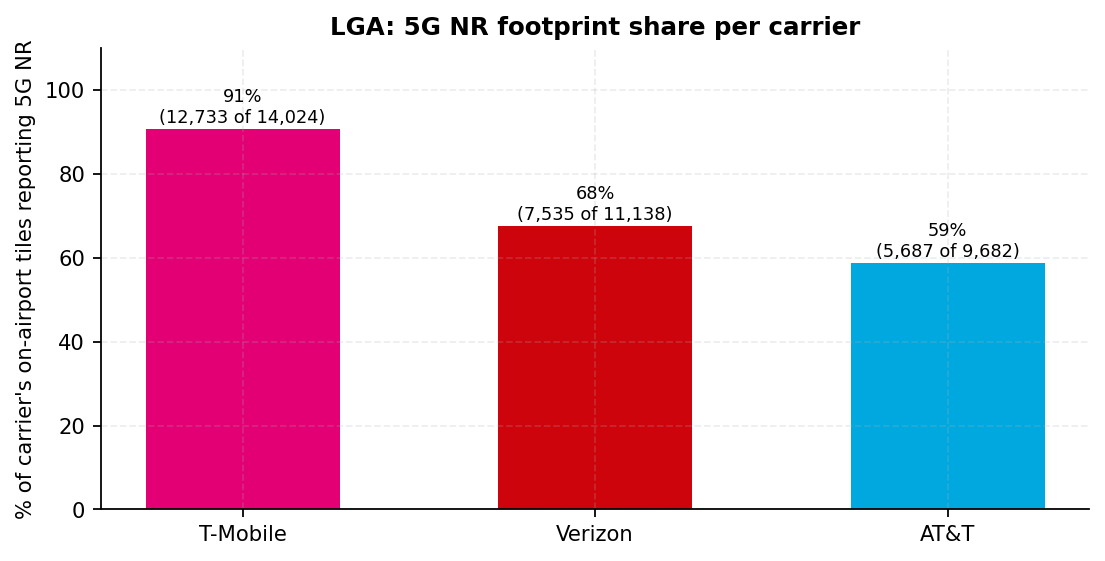
80 gates healthy). It reports 5G on 91% of its on-airport tiles (12,733 of 14,024); Verizon reports 5G on
68% and AT&T on 59%. Its LTE layer is the weakest of the three: LTE gate median −95.0 dBm, healthy at 40 of
80 gates, and the strongest LTE reading at 0 gates.
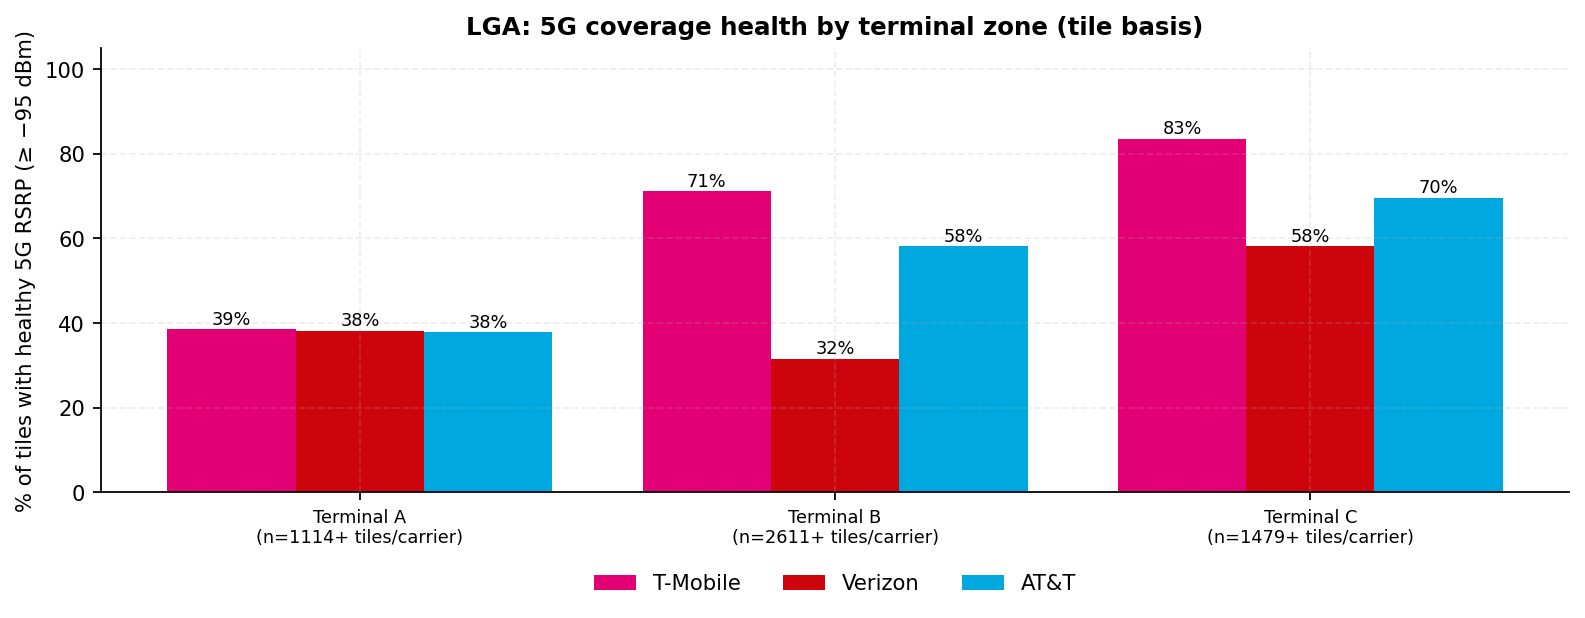
On the tile basis T-Mobile leads Terminal B and Terminal C: healthy on 71% of Terminal B tiles (n=5,437)
and 83% of Terminal C tiles (n=3,746). Terminal A is a three-way tie at 39%, 38% and 38% healthy (n=2,449
T-Mobile tiles), inside the noise floor. Inside the pinned building footprints
(section 4.7) it is healthy on 95% of Terminal B headhouse tiles and 86% of Terminal C tiles. Fig. 4 shows
the pattern: green across the Terminal B headhouse and concourses, Terminal C, and the roadway spine. Its
terminal-vs-periphery proxy is +5.0 dB (section 5.2), which the export cannot resolve between close-in
coverage and an in-building or small-cell source. The public record names no carrier on the Terminal B
system cited.
3.2 Verizon results
Verizon's 5G gate median is −98.3 dBm, 3.3 dB below the healthy threshold and 7.5 dB behind T-Mobile.
6 of 80 gates (7.5%; 11 gates within 1 dB of the line) are healthy, 74 are at risk, and 0 are critical. Its
5G signal quality is the lowest of the
three: SINR median +5.5 dB, healthy at 3 of 80 gates. It reports 5G on 68% of its on-airport tiles (7,535
of 11,138). Verizon is the weakest carrier at 41 of 80 ranked asymmetry gates (section 10).
Verizon's LTE layer is the network of record. It is the strongest LTE carrier at 56 of 80 gates with an
LTE gate median of −86.8 dBm (77 of 80 gates healthy). On the tile basis Verizon is healthy on 58% of
Terminal C tiles, 38% of Terminal A tiles, and 32% of Terminal B tiles; Terminal B is its weakest zone.
Inside the footprints, Verizon's 5G is healthy on 24% of Terminal B headhouse tiles and 37% of Terminal C
tiles, against 72% in the Eastern Concourse (section 4.7). Verizon's 5G is C-band (NR3700 on 70% of its
band-reporting 5G tiles), so strong LTE with weak 5G over the same buildings is first the expected macro
propagation picture for a large building (section 1); the second hypothesis, an in-building or close-in
source that carries Verizon LTE but not Verizon 5G, is what the Recommendation 1 attestation tests. The
export cannot separate the two. Its terminal-vs-periphery proxy is +5.0 dB (section 5.2).
3.3 AT&T results
AT&T's 5G gate median is −98.6 dBm, 3.6 dB below the healthy threshold, 7.8 dB behind T-Mobile, and
0.3 dB from Verizon (a tie under the noise floor). 14 of 80 gates (17.5%; 11 gates within 1 dB of the line)
are healthy, 66 are at risk, and 0 are
critical. SINR is +8.4 dB at the median (20 of 80 gates healthy). AT&T is the weakest carrier at 35 of 80
ranked asymmetry gates.
The 5G footprint is the smallest of the three: AT&T reports 5G on 59% of its on-airport tiles (5,687 of
9,682); tiles with an LTE reading but no 5G reading are 39% of its tiles. The LTE layer is healthy: LTE gate
median −87.8 dBm, healthy at 75 of 80 gates, strongest LTE reading at 24 gates. On the tile basis AT&T is
healthy on 70% of Terminal C tiles, 58% of Terminal B tiles, and 38% of Terminal A tiles, ahead of Verizon
in Terminals B and C and behind T-Mobile in Terminals B and C and tied in Terminal A; Terminal A (Marine
Air Terminal) is its lowest zone. AT&T's 5G is C-band and 3.45 GHz (NR3700 or NR3500 on 87% of 319
band-reporting 5G tiles, a small cell-resolved sample), so the same macro propagation reading as Verizon's
applies first, with the in-building hypothesis second.
On Fig. 4, AT&T's panel shows amber and grey across the Terminal B headhouse and the Terminal C piers; the
building-masked view (section 4.7) quantifies it per building.
3.4 5G footprint and coverage-band attachment
Fig. 5 · 5G footprint · share of tiles with a 5G NR readingSource · Ookla
Share of each carrier's on-airport tiles that report a 5G NR reading (5G footprint). Source: Ookla Cell Analytics per-carrier RF tile export, 2025-09-01 to 2026-08-31.
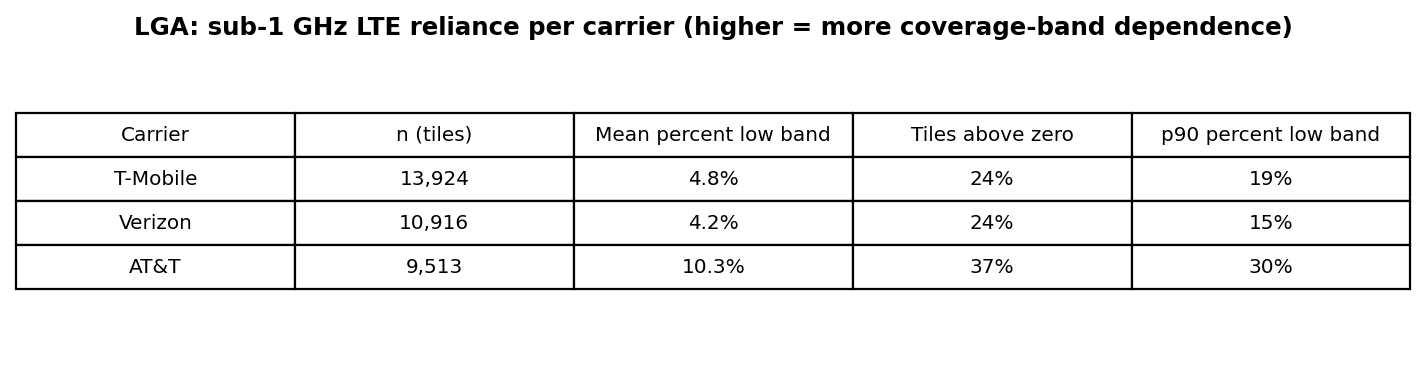
LTE percent-low-band per carrier: mean, share of tiles above zero, and p90. Higher means more attachment to sub-1 GHz coverage bands. Source: Ookla Cell Analytics per-carrier RF tile export, 2025-09-01 to 2026-08-31.
The percent-low-band statistic describes LTE coverage-band attachment. A tile that attaches to sub-1 GHz
spectrum is using a coverage-grade band, which propagation, carrier idle-mode priorities, and site geometry
all drive. T-Mobile mean 4.8% (tiles above zero: 24% of n=13,924; p90 19%) · Verizon mean 4.2% (tiles
above zero: 24% of n=10,916; p90 15%) · AT&T mean 10.3% (tiles above zero: 37% of n=9,513; p90 30%).
The LTE metric does not see 5G low band. On the 5G side: T-Mobile: NR600 on 1,688 tiles, 13.9% of its
12,120 band-reporting NR tiles. Verizon: NR850 on 875 tiles, 20.6% of its 4,253 band-reporting NR tiles.
AT&T: NR850 on 37 tiles, 11.6% of its 319 band-reporting NR tiles. Section 9.1 lists the bands.
3.5 RSRQ, channel quality (CQI), and optimization priority
RSRQ medians: T-Mobile NR −11.0 / LTE −14.0 dB; Verizon NR −12.0 / LTE −11.0 dB; AT&T NR −13.0 /
LTE −12.0 dB. Every carrier's median sits below the -10 dB line on both technologies. Medians of −11 to
−14 dB are ordinary loaded-network values, and the line is a generic reference, not a venue-specified
threshold, so this is a venue-wide observation to read together with SINR, not a failure call. RSRQ
degrades as subframe utilization rises, so a weak RSRQ on a strong-RSRP network is
consistent with a loaded serving layer. This is an inference; the export carries no load field (section 16).
CQI medians: T-Mobile median 9.0 (n=2,859); Verizon median 9.0 (n=4,289); AT&T median 9.0 (n=3,461).
CQI is the closest throughput proxy in an export that carries no throughput fields. Ookla's LTE
optimization priority is the vendor's own index for tiles where signal is strong but quality is poor.
Venue medians: T-Mobile median 63 (n=8,220); Verizon median 60 (n=9,001); AT&T median 62 (n=8,302). The
discriminating signal is in the distribution tails. The RSRQ, CQI, and optimization-priority distributions
(Figs. 7 and 8) ship in the PDF.
Where the strongest cell at a tile is not the most-frequent serving cell, the network is handing over
between competing cells. Measured churn: T-Mobile LTE 44% (n=9,727) / 5G 49% (n=12,119); Verizon LTE 43%
(n=9,852) / 5G 20% (n=4,252); AT&T LTE 42% (n=9,276) / 5G 5% (n=319). Cell, PCI, and band fields populate
only where Ookla resolved a serving cell, which is why AT&T's 5G n is 319 here against 5,687 for RSRP
(field population table, section 16). AT&T's 5G churn therefore rests on 319 cell-resolved tiles and is
not representative; its bar is hatched and is not compared with the other two. Churn blends macro-sector
overlap with any in-building system's
handoff to the macro layer. This is a proxy; the export carries no handover trace. Fig. 9 ships in the PDF.
Section 4
The view by terminal zone
A · B · C · tile basis
Terminal zone gate counts (Terminal A 6, Terminal B 36, Terminal C 38): Terminal A holds 6 gates, below
the 30-point floor, so its gate tallies appear as counts and are never ranked. Terminals B and C clear the
floor, so their gate shares are shown as percentages. For one consistent basis, every zone comparison in
this section runs on the tile basis: a tile belongs to the zone of its nearest gate or tenant point within
500 m, which gives hundreds of tiles per carrier per zone.
4.1 Healthy share and median RSRP by zone
Zone
T-Mobile healthy tiles
Verizon healthy tiles
AT&T healthy tiles
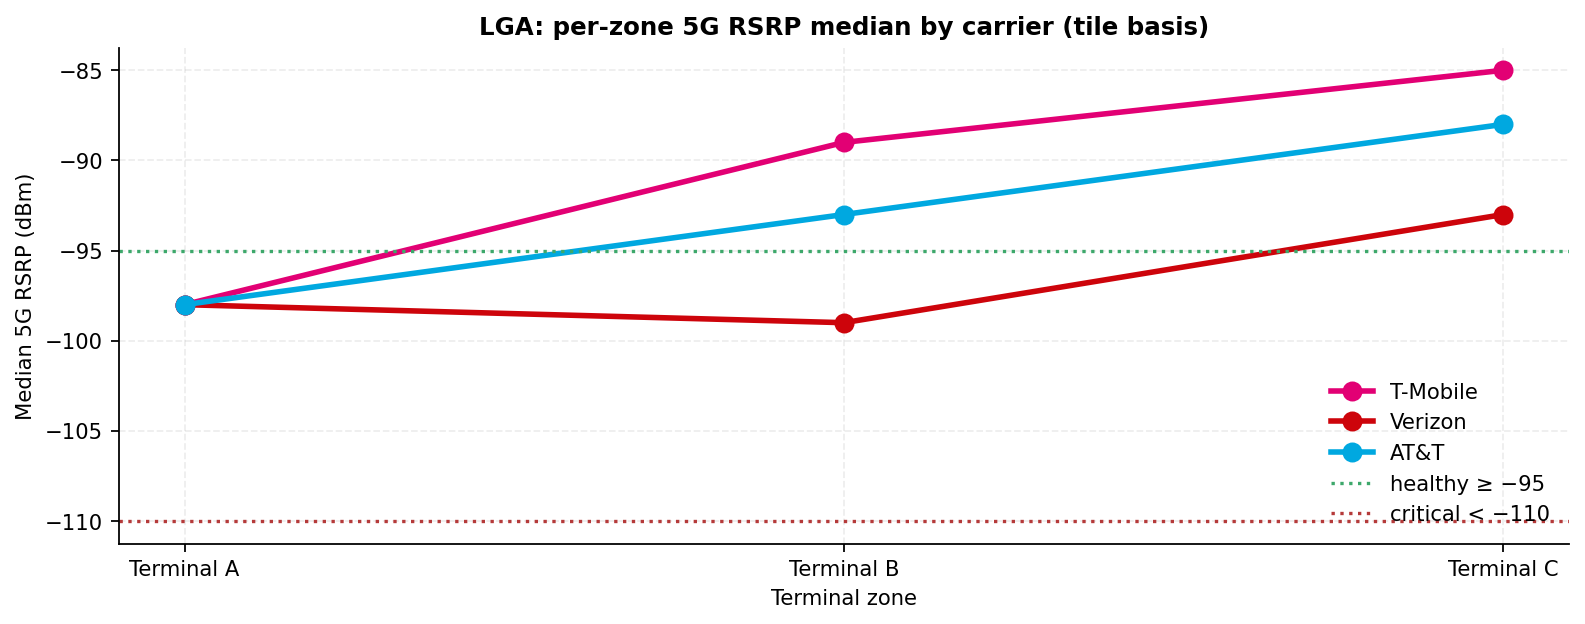
Median 5G RSRP (dBm) T-Mobile / Verizon / AT&T
Terminal A
39%n=2,449
38%n=1,211
38%n=1,114
−98.0 / −98.0 / −98.0
Terminal B
71%n=5,437
32%n=3,349
58%n=2,611
−89.0 / −99.0 / −93.0
Terminal C
83%n=3,746
58%n=2,212
70%n=1,479
−85.0 / −93.0 / −88.0
Healthy share and median on the tile basis; n = tiles per carrier per zone. Healthy = tile 5G RSRP ≥ −95 dBm.
Zone leader on the tile basis (a lead under 1 dB on the median or under 1 point on the healthy share is a
tie): Terminal A three-way tie (AT&T, T-Mobile, Verizon), Terminal B T-Mobile, Terminal C T-Mobile.
Second place where there is a leader: Terminal B AT&T (−93.0 dBm, 58% healthy); Terminal C AT&T
(−88.0 dBm, 70% healthy). Lowest zone per carrier on the healthy tile share: T-Mobile in Terminal A (39%),
Verizon in Terminal B (32%), AT&T in Terminal A (38%). The lowest zone differs by carrier: Terminal A
is the low zone for T-Mobile and AT&T while Verizon's low zone is Terminal B.
Fig. 10 · Healthy 5G tile share by zone and carrierSource · Ookla
Fig. 11 · Median 5G RSRP by zone and carrierSource · Ookla
Tile basis; minimum n per carrier on the axis. Source: Ookla Cell Analytics per-carrier RF tile export, 2025-09-01 to 2026-08-31.
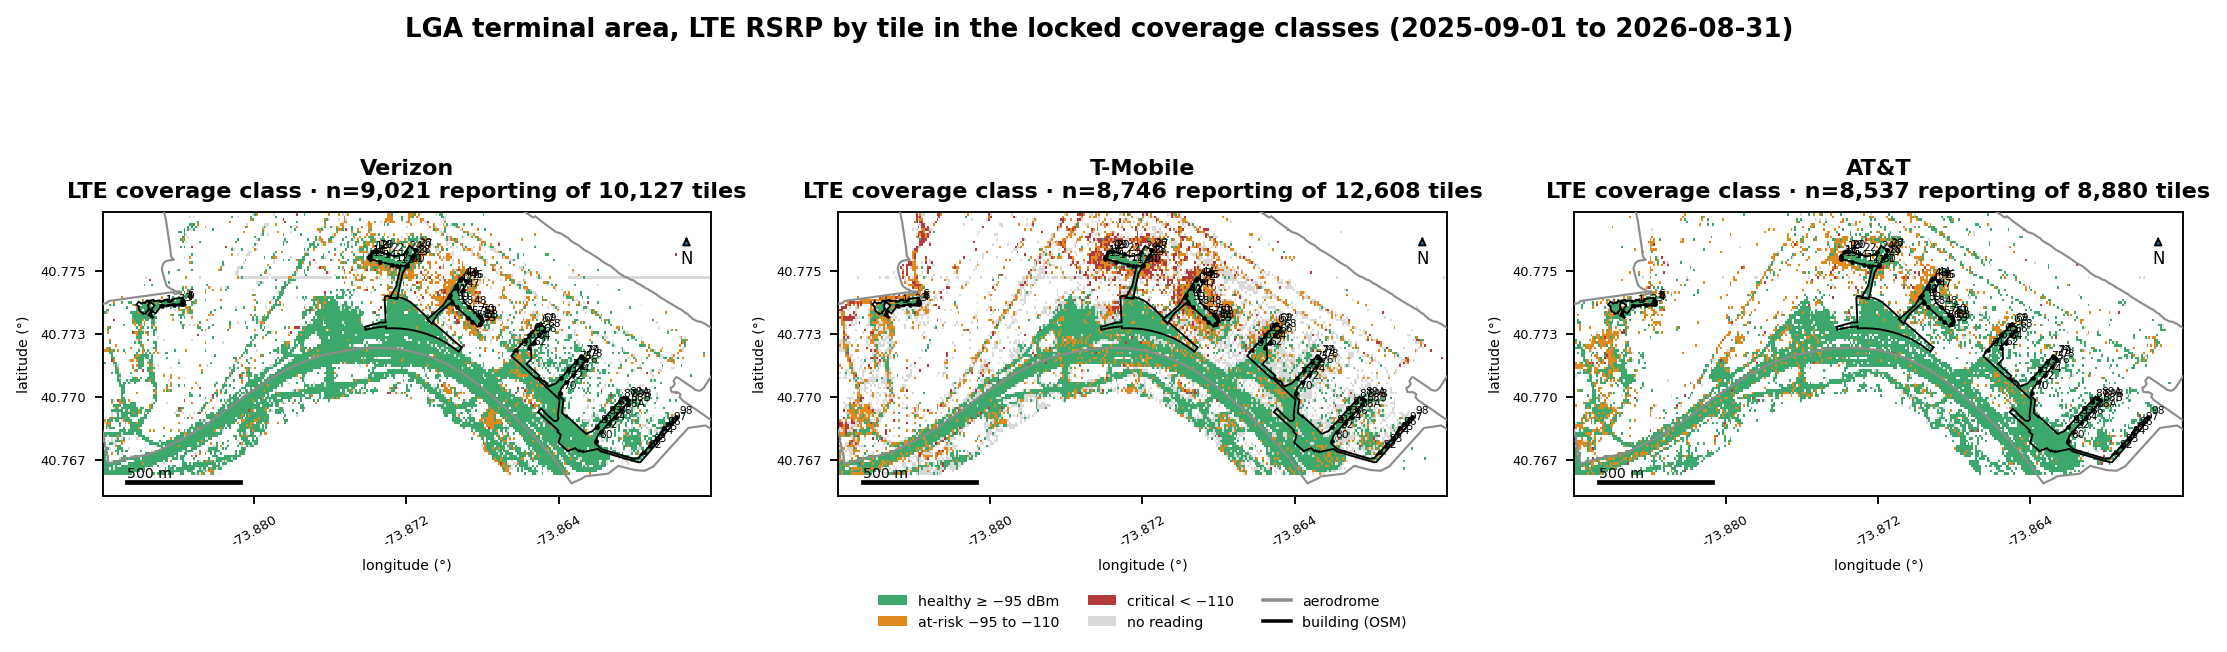
Fig. 12 · LTE RSRP by tile and carrier · terminal area · locked coverage classSource · Ookla
Terminal-area map of LTE RSRP by tile and carrier, colored by the locked coverage class. Grey tiles carry no LTE reading. Source: Ookla Cell Analytics per-carrier RF tile export, 2025-09-01 to 2026-08-31.
4.2 Coverage class and PCI diversity
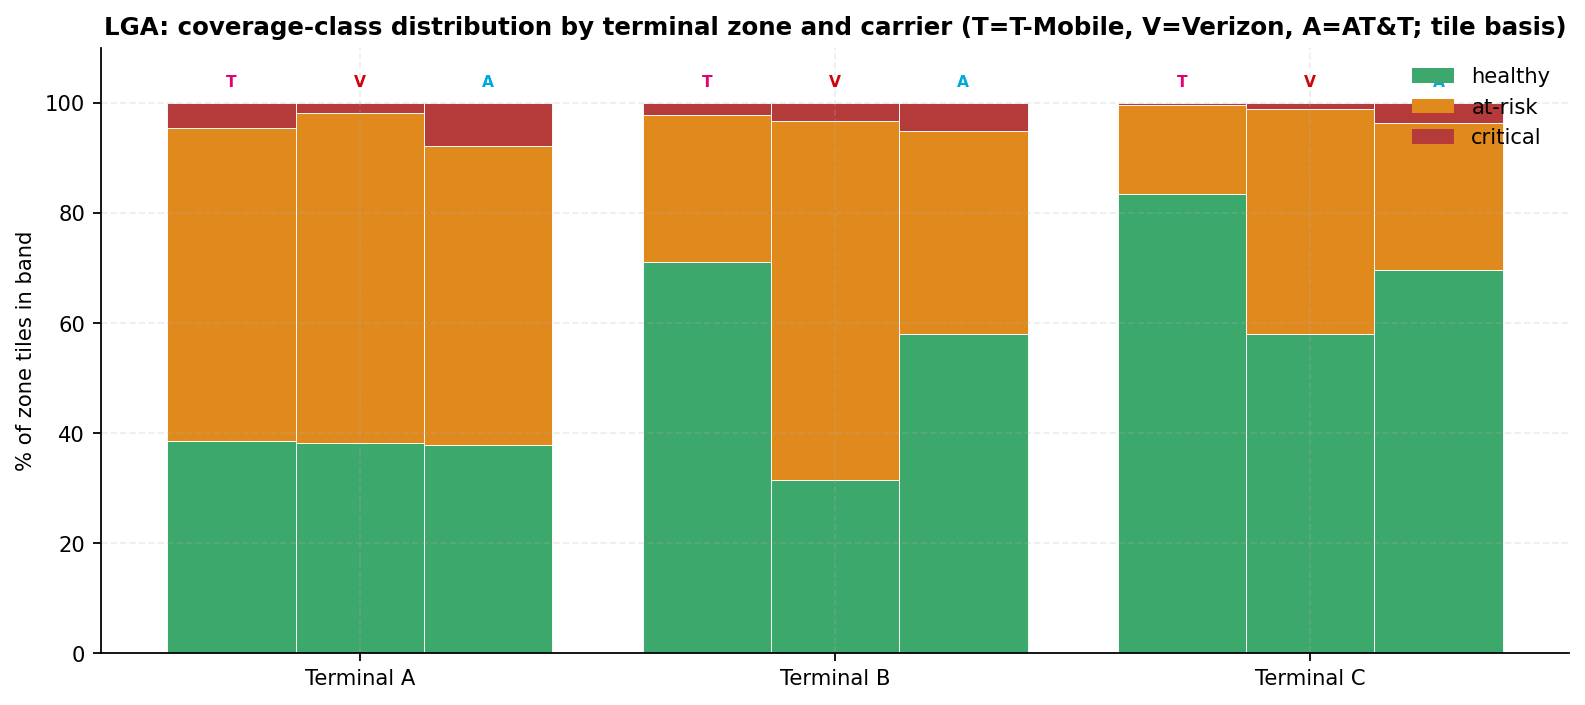
Critical-band gates (below −110 dBm) by carrier: T-Mobile 0, Verizon 0, AT&T 0 of 80 gates (counts).
On the tile basis the critical share peaks at T-Mobile 4% in Terminal A (n=2,449); Verizon 3% in Terminal
B (n=3,349); AT&T 8% in Terminal A (n=1,114). T-Mobile's healthy share does not drop below 39% in any zone.
Fig. 13 · Coverage-class distribution by terminal zone and carrierSource · Ookla
T = T-Mobile, V = Verizon, A = AT&T. Tile basis. Source: Ookla Cell Analytics per-carrier RF tile export, 2025-09-01 to 2026-08-31.
The PCI picture in each zone reflects which sectors reach it, macro or in-building. Higher diversity with
healthy SINR means several sectors serve the zone cleanly. Higher diversity with poor SINR means they
compete. Verizon's low 5G SINR median (+5.5 dB) alongside its PCI count is the pairing to read here.
AT&T's 5G PCI counts rest on 319 cell-resolved tiles and are not representative (hatched). PCI counts
accumulate over 12 months across every 5G carrier layer, so PCI reassignment and multi-carrier layers
inflate them. Fig. 14 (unique strongest-serving PCIs per zone per carrier) ships in the PDF.
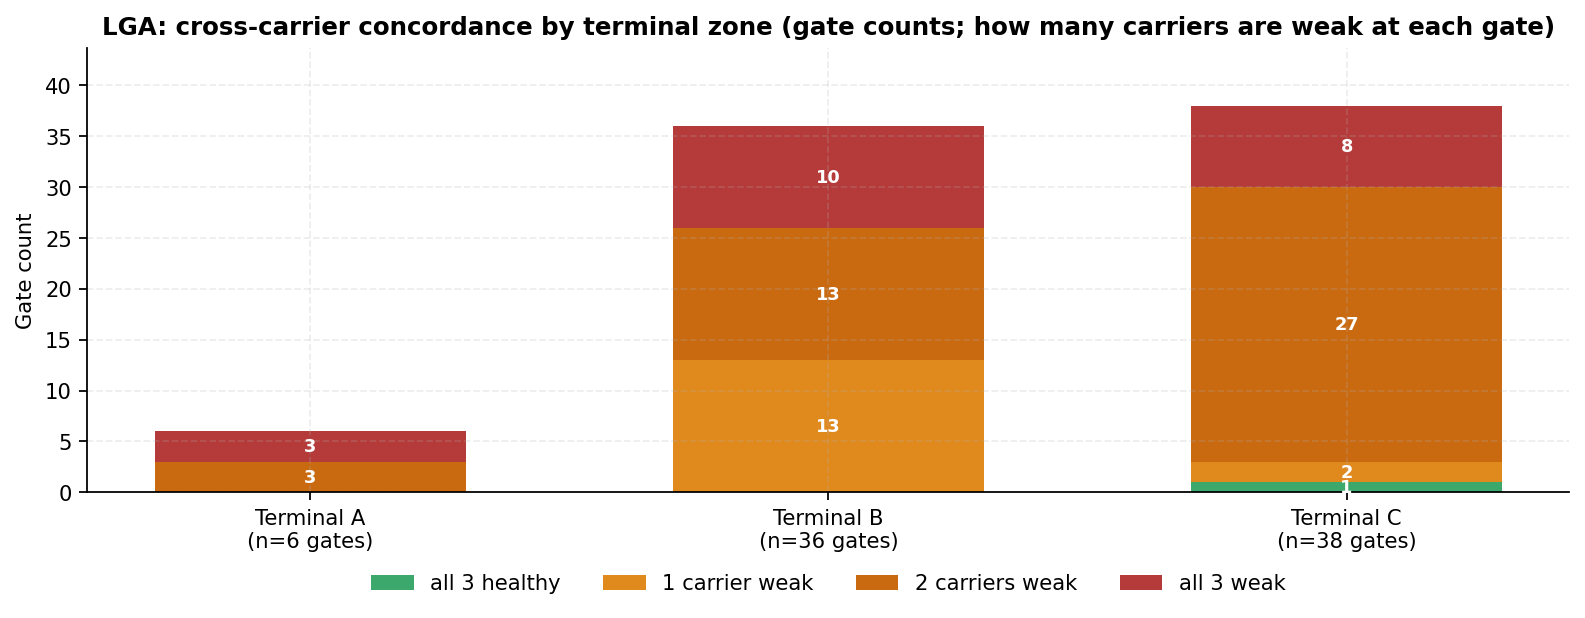
4.3 Cross-carrier concordance by gate
This split shapes the infrastructure question. A gate weak for all three carriers points to a gate-area
problem for that gate's 80 m circle, which can include apron. A gate weak for exactly one carrier points
to that carrier's path.
1
Gate healthy for all three carriers · of 80
15
Gates weak for exactly one carrier · T-Mobile 2 · Verizon 11 · AT&T 2
43
Gates weak for two carriers · Verizon and AT&T at 42 · T-Mobile and AT&T at 1
21
Gates weak for all three carriers · Terminal A 3 · Terminal B 10 · Terminal C 8
This is not a single-carrier path problem. Two carriers are below the healthy 5G line at 64 of 80
gates, and the pair is almost always Verizon and AT&T. Read with the LTE result (both healthy at the same
gates), the gap is a 5G NR layer gap for two carriers over the same buildings, which is what an in-building
system that carries 5G NR for every carrier would address. The concordance does not by itself say whether
the Terminal B system in the design record carries those carriers' 5G; Recommendation 1 asks for that
attestation.
Fig. 15 · Carriers below the healthy line per gate, by terminal zoneSource · Ookla
Terminal B is operated by LaGuardia Gateway Partners (Vantage Group and Meridiam) under a public-private
lease with PANYNJ and hosts Air Canada, American Airlines, Frontier Airlines, JetBlue, Porter Airlines,
Southwest Airlines, and United Airlines cited. It holds 36 of the 80
measured gates across headhouse plus the Eastern and Western concourses linked by two pedestrian bridges.
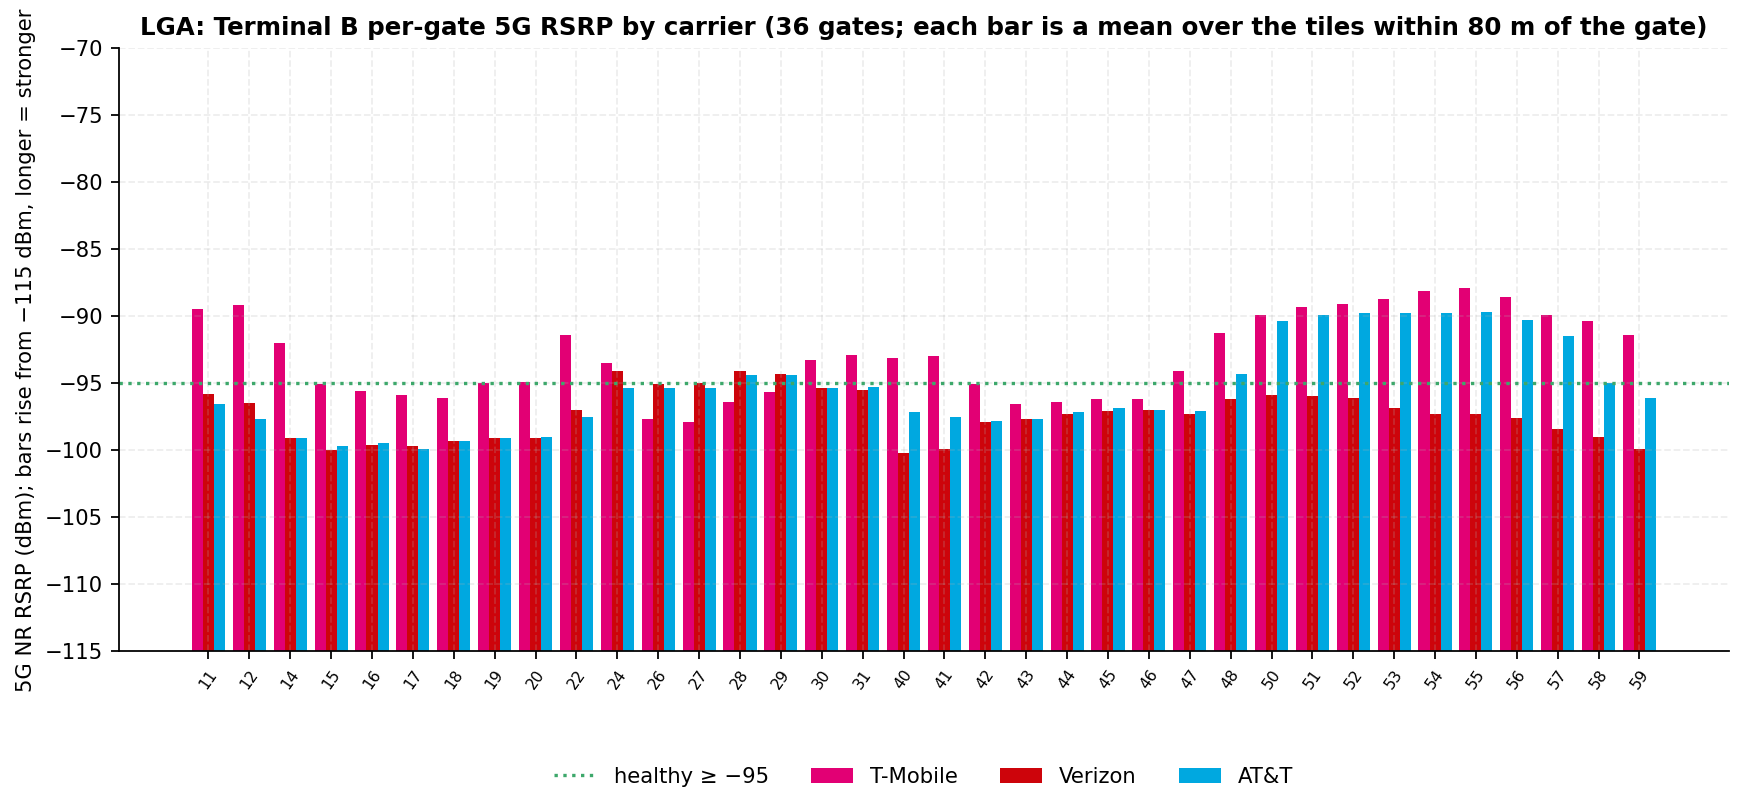
Best-5G counts: T-Mobile 32, Verizon 4. Healthy 5G gates: T-Mobile 23 of 36 gates (64%), Verizon 4 of 36
gates (11%), AT&T 12 of 36 gates (33%). Gate-basis 5G medians: T-Mobile −93.2, Verizon −97.3, AT&T −96.3
dBm. Tile-basis healthy shares: T-Mobile 71%, Verizon 32%, AT&T 58% (n ≥ 2,611 tiles per carrier). Boingo's
Terminal B neutral-host DAS and Wi-Fi system was designed for the headhouse and the 18-gate eastern
concourse; the Western Concourse is not stated in that record
cited. The design record's 18-gate eastern concourse corresponds to
19 Eastern Concourse gates in the OpenStreetMap inventory (gates 40 to 59), one more than the record
states. The measured split between the headhouse and the two concourses is in section 4.7.
OpenStreetMap inventory. Each bar is a mean over the tiles within 80 m of the gate. Source: Ookla Cell Analytics per-carrier RF tile export, 2025-09-01 to 2026-08-31.
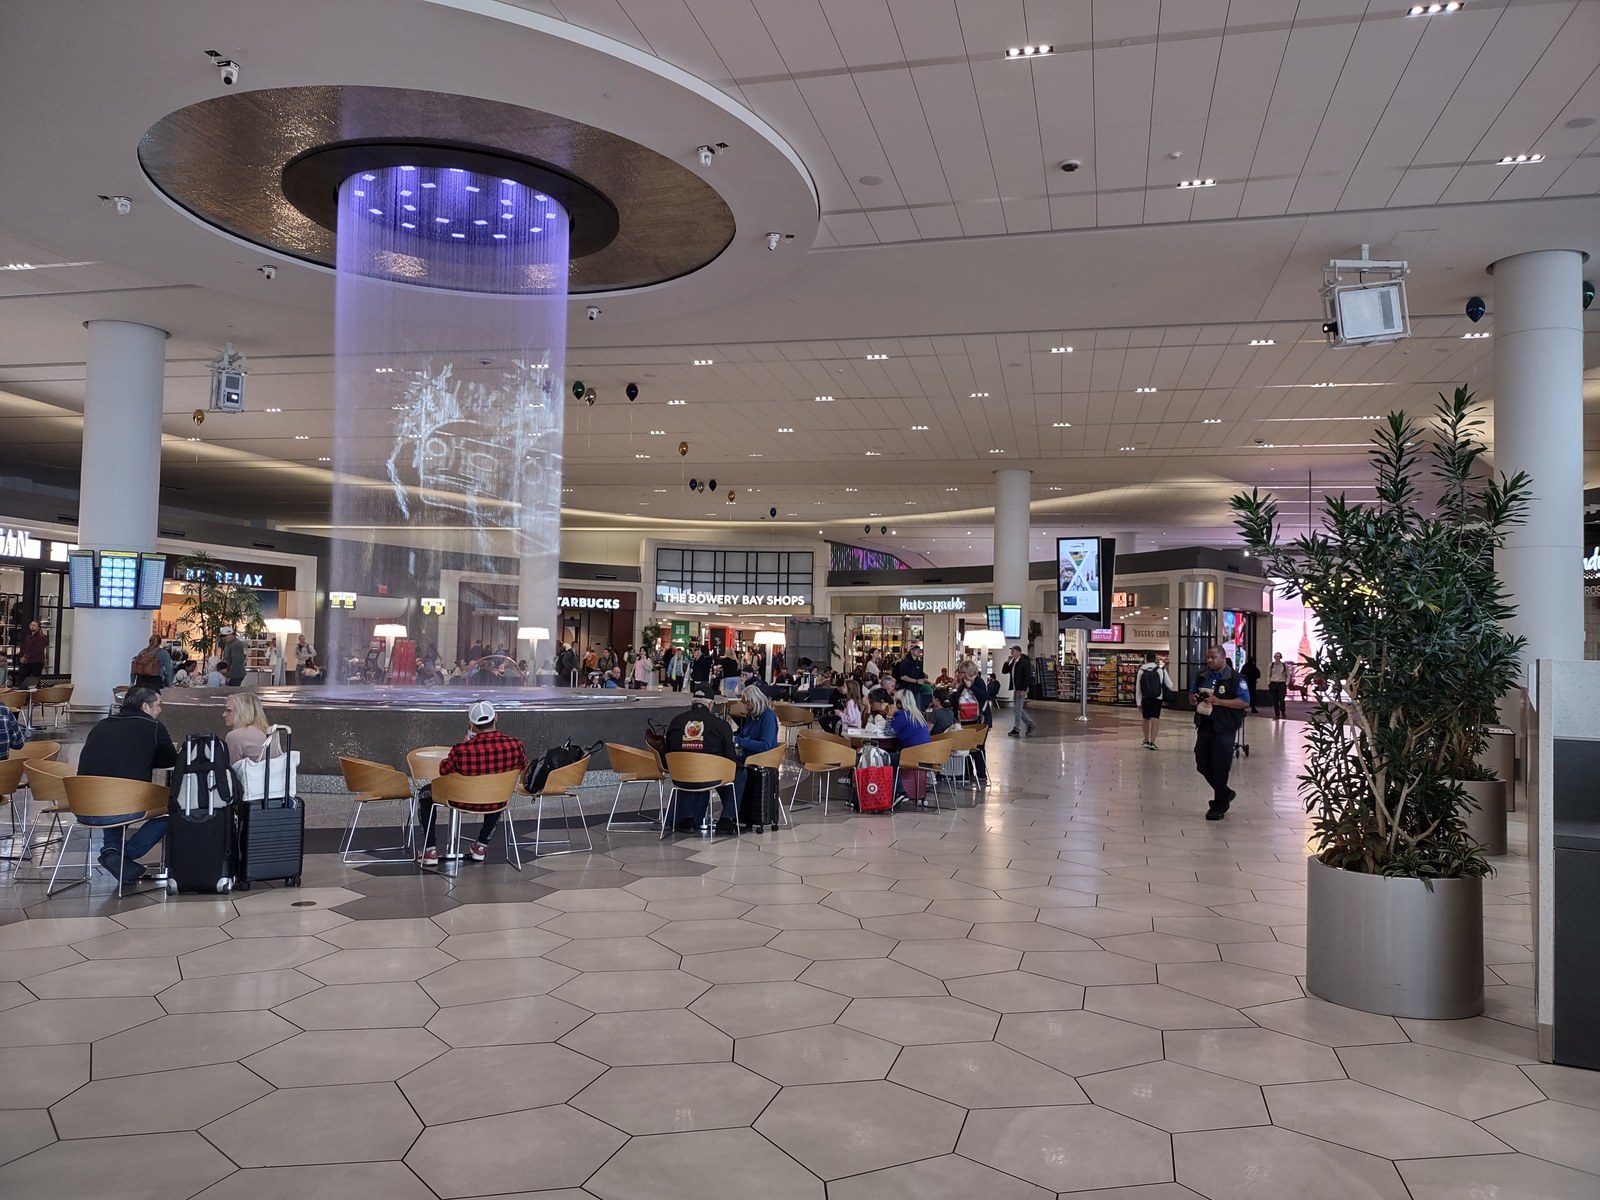
Photo · Terminal B food hall, October 2024Wikimedia Commons
Terminal B food hall, October 2024. Photo: Jim.henderson, CC BY-SA 4.0, via Wikimedia Commons. Illustrative, resized only.
4.5 Terminal C
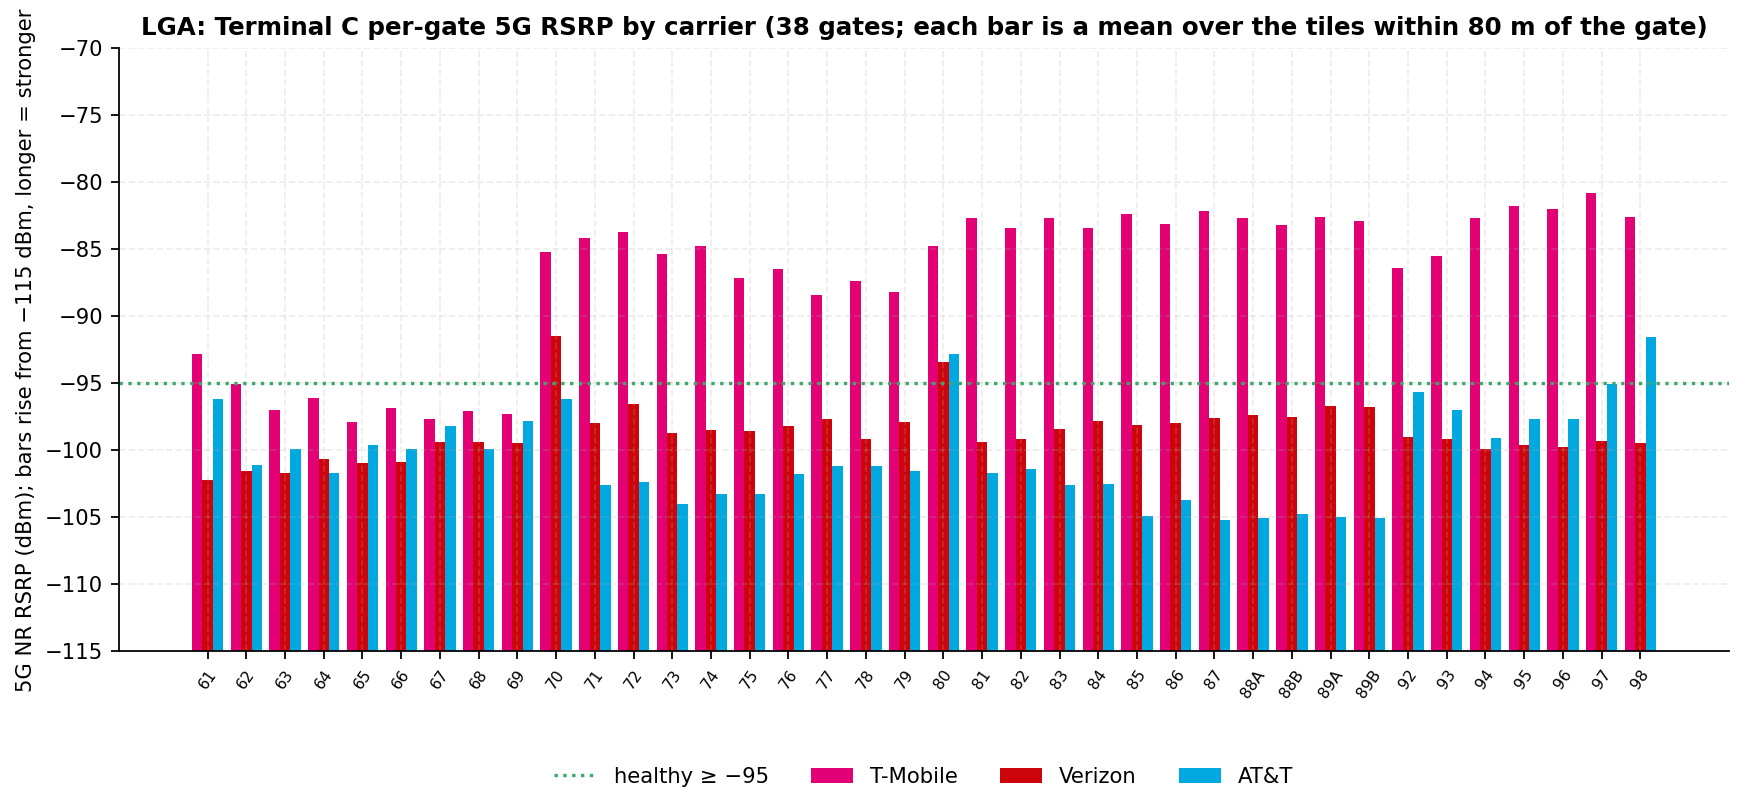
Terminal C is operated by Delta Air Lines under a lease with PANYNJ and hosts Delta Air Lines (the only
airline listed by PANYNJ); the former Terminal D is part of the consolidated Terminal C
cited. It holds 38 of the 80 measured gates. Best-5G counts:
T-Mobile 38. Healthy 5G gates: T-Mobile 30 of 38 gates (79%), Verizon 2 of 38 gates (5%), AT&T 2 of 38
gates (5%). Gate-basis 5G medians: T-Mobile −84.8, Verizon −98.8, AT&T −101.3 dBm. Tile-basis healthy
shares: T-Mobile 83%, Verizon 58%, AT&T 70% (n ≥ 1,479 tiles per carrier). The top of the asymmetry atlas
(section 10) sits here: the 5 largest carrier spreads of the top five are Terminal C gates. No public
source names the in-building cellular partner for Terminal C cited.
OpenStreetMap inventory. Each bar is a mean over the tiles within 80 m of the gate. Source: Ookla Cell Analytics per-carrier RF tile export, 2025-09-01 to 2026-08-31.
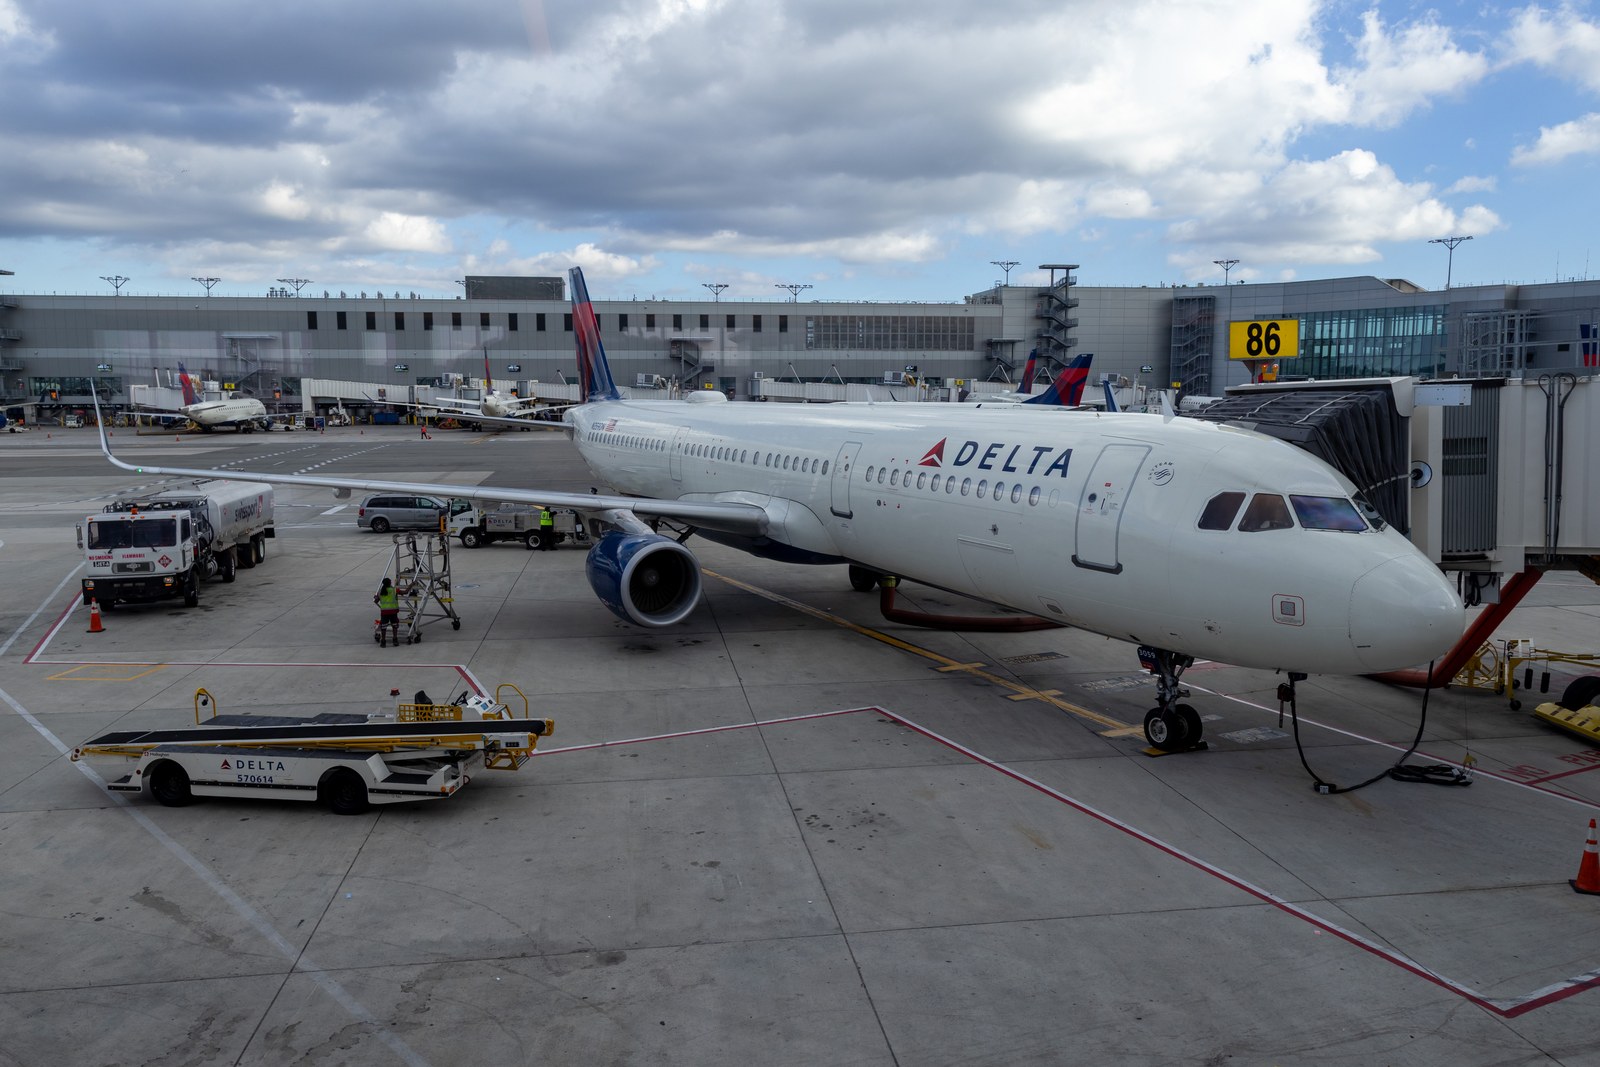
Photo · Apron side of Terminal C at gate 86, September 2025Wikimedia Commons
Apron side of Terminal C at gate 86 with a Delta A321, September 2025. Photo: Nielsoncaetanosalmeron, CC BY 4.0, via Wikimedia Commons. Illustrative, resized only.
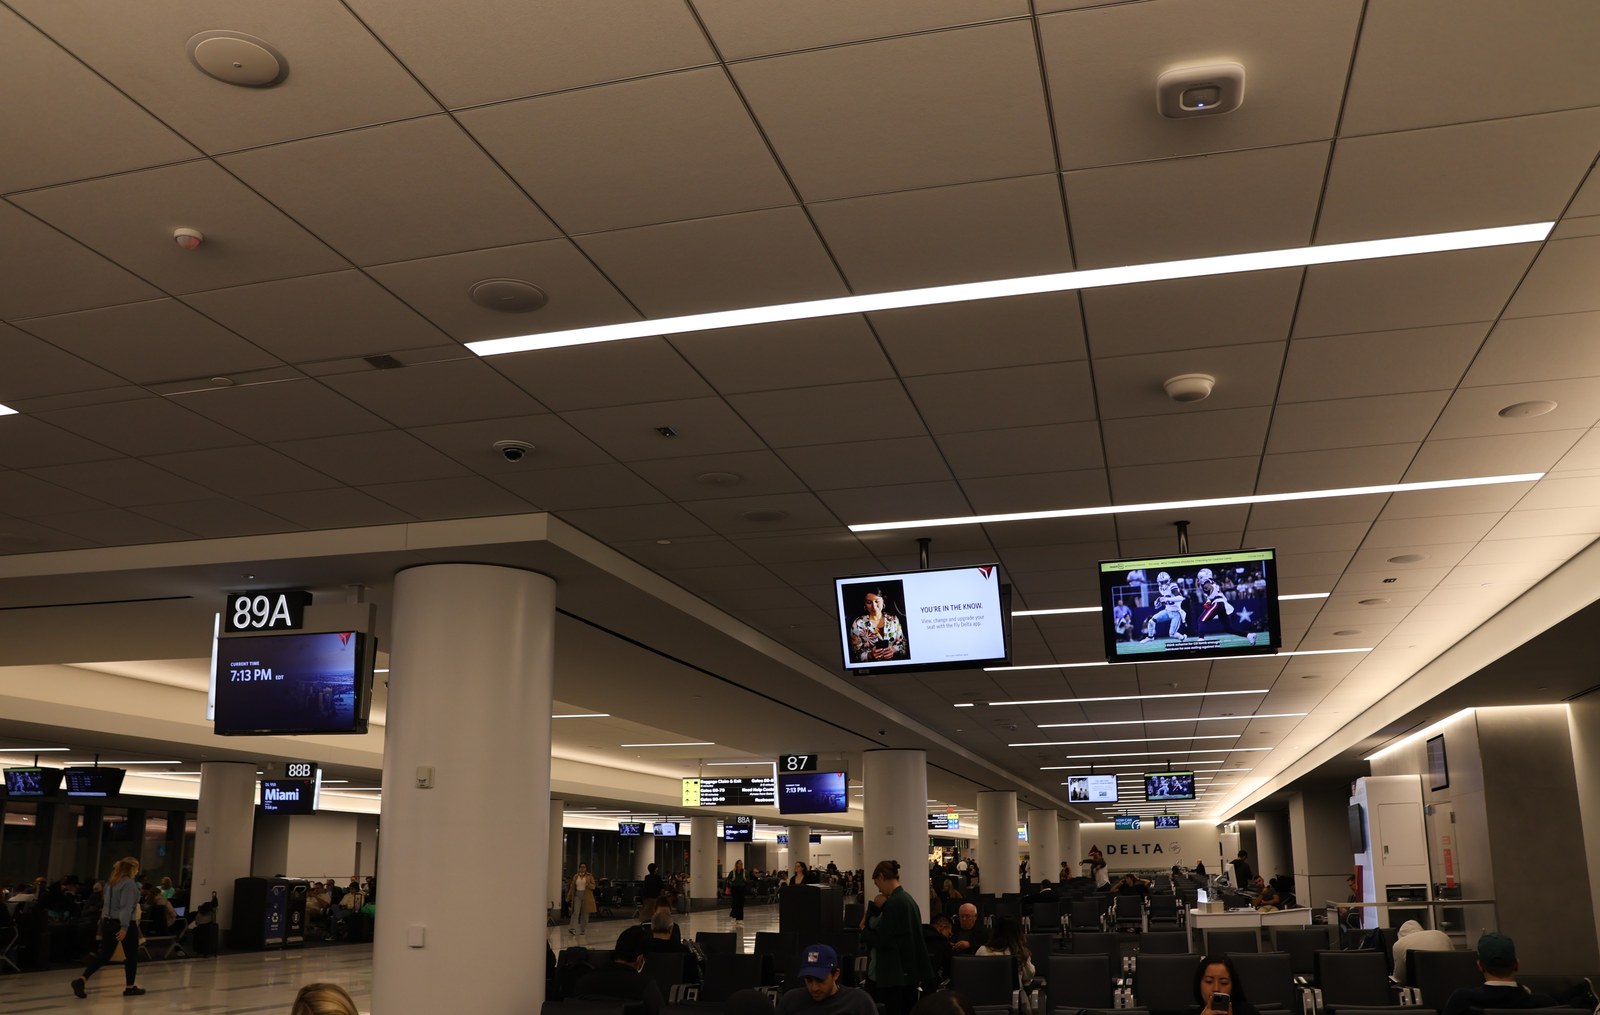
Photo · Terminal C gate 89A hold room, October 2023Wikimedia Commons
Terminal C gate 89A hold room, October 2023. Photo: DiscoA340, CC BY-SA 4.0, via Wikimedia Commons. Illustrative, resized only.
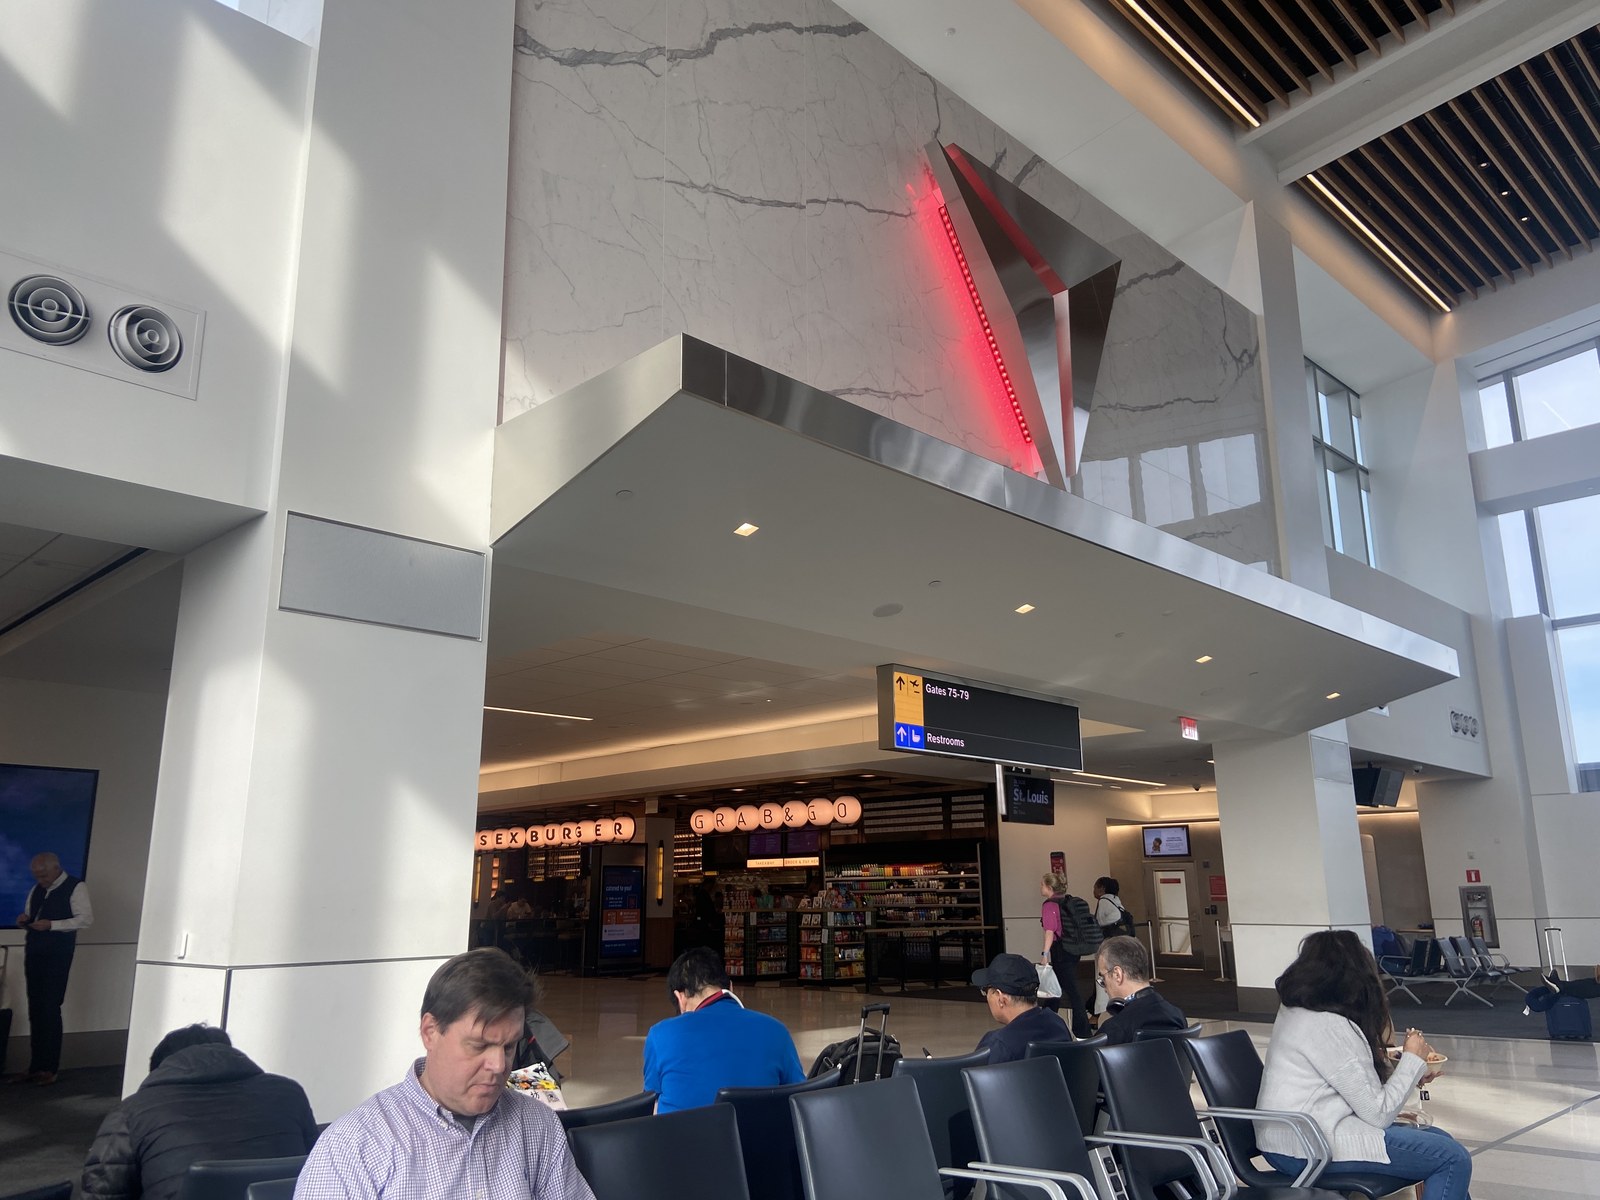
Photo · Terminal C concourse at the Delta gates 70 to 79, May 2024Wikimedia Commons
Terminal C concourse at the Delta gates 70 to 79, May 2024. Photo: Myotus, CC0, via Wikimedia Commons. Illustrative, resized only.
4.6 Terminal A (Marine Air Terminal)
Terminal A holds 6 gates, below the 30-point floor, so its gate figures are counts. Spirit Airlines was
the sole commercial lessee of the six gates until Spirit Airlines ceased all operations on 2026-05-02; the terminal then
closed to the public for the rest of the window cited; the window
therefore blends eight months of scheduled operation with four months of closure. JetBlue acquired
Spirit's LGA operating authorizations at auction in July 2026 and has said it wants to use the Marine Air
Terminal, not before 2027 and subject to approvals (intent, not an operation in the window)
cited. On the tile basis Terminal A is a three-way tie inside the
noise floor. Healthy 5G gates (counts): T-Mobile 3 of 6 gates (count), Verizon 0 of 6 gates (count),
AT&T 0 of 6 gates (count). Tile-basis healthy shares: T-Mobile 39%, Verizon 38%, AT&T 38% (n ≥ 1,114
tiles per carrier); medians T-Mobile −98.0, Verizon −98.0, AT&T −98.0 dBm. Terminal A is the low zone for
T-Mobile and AT&T on the tile basis. The zone's 2,449-tile pool includes parking and roadway; the Marine
Air Terminal building footprint itself holds 25 Verizon and 24 AT&T 5G-reporting tiles, below the 30-tile
floor (section 4.7). The 2026 to 2035 Port Authority capital plan (approved December 2025) funds a rebuild
of the non-landmarked gate areas of the Marine Air Terminal; the dollar figure and schedule are not
published cited, which makes this zone the acceptance zone for
whatever comes next: section 14 writes its criteria as at-reopening criteria on the rebuilt gate-area
footprint.
Photo · The Marine Air Terminal, November 2025Wikimedia Commons
The Marine Air Terminal, November 2025, during the final months of Spirit Airlines' scheduled service; the terminal closed to the public after Spirit Airlines ceased all operations on 2026-05-02. Photo: Epicgenius, CC BY-SA 4.0, via Wikimedia Commons. Illustrative, resized only.
4.7 Building-masked view (OSM polygons)
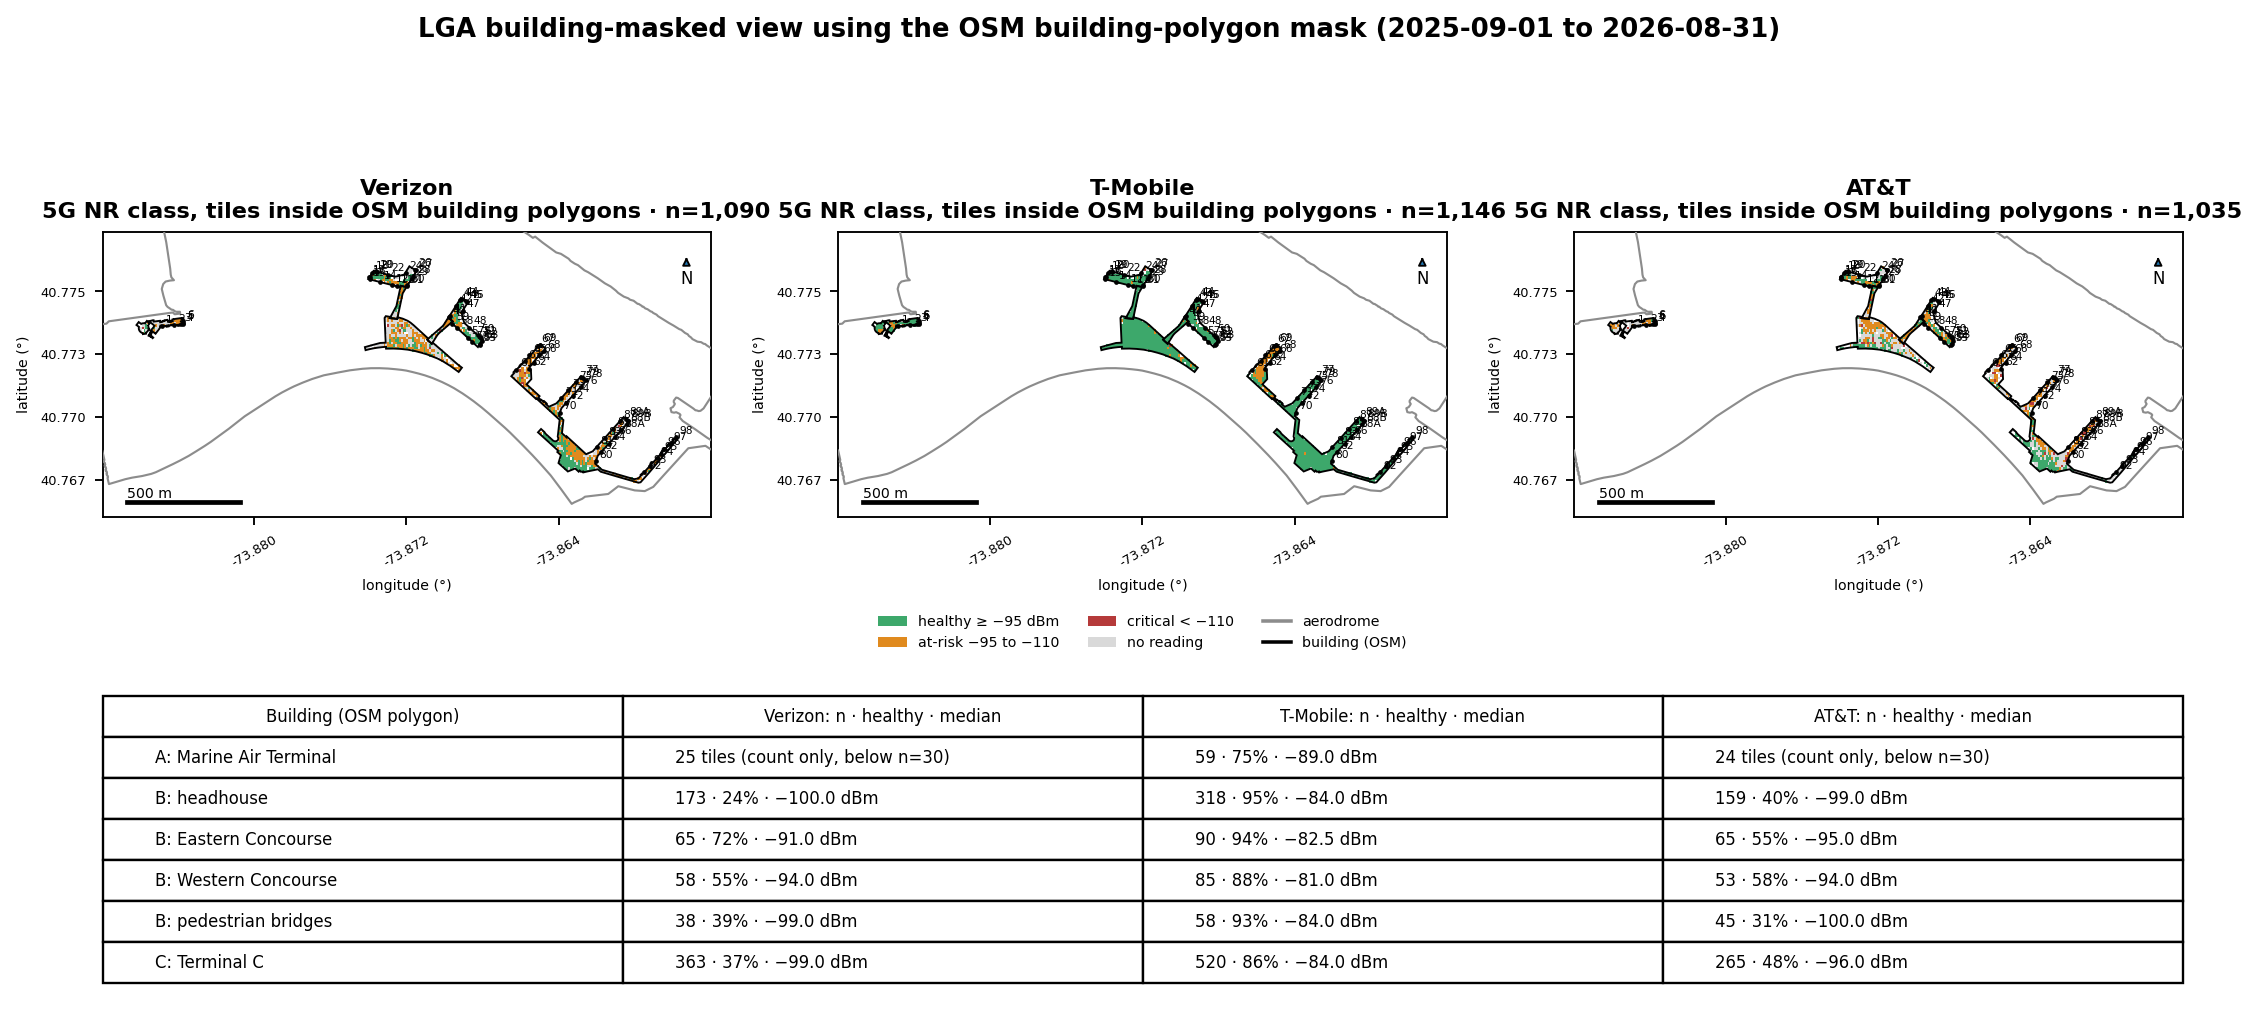
Fig. 18 · Building-masked view · 5G NR class for tiles inside the OSM footprintsSource · Ookla
Tiles whose centroid falls inside a pinned OSM building polygon (Marine Air Terminal, Terminal B headhouse, Eastern and Western concourses, pedestrian bridges, Terminal C), colored by 5G NR class. This is our OSM building-polygon mask, not Ookla's Indoor layer. Source: Ookla Cell Analytics per-carrier RF tile export, 2025-09-01 to 2026-08-31.
Building (OSM polygon)
T-Mobile · n · healthy · median
Verizon · n · healthy · median
AT&T · n · healthy · median
A: Marine Air Terminal
59 · 75% · −89.0 dBm
25 tilescount only, below n=30
24 tilescount only, below n=30
B: headhouse
318 · 95% · −84.0 dBm
173 · 24% · −100.0 dBm
159 · 40% · −99.0 dBm
B: Eastern Concourse
90 · 94% · −82.5 dBm
65 · 72% · −91.0 dBm
65 · 55% · −95.0 dBm
B: Western Concourse
85 · 88% · −81.0 dBm
58 · 55% · −94.0 dBm
53 · 58% · −94.0 dBm
B: pedestrian bridges
58 · 93% · −84.0 dBm
38 · 39% · −99.0 dBm
45 · 31% · −100.0 dBm
C: Terminal C
520 · 86% · −84.0 dBm
363 · 37% · −99.0 dBm
265 · 48% · −96.0 dBm
Healthy = tile 5G RSRP ≥ −95 dBm; median over tiles inside the polygon. n counts tiles, not scans. Cells with n < 30 are counts.
The mask is a point-in-polygon test of tile centroids against the pinned OpenStreetMap footprints, so it
selects tiles over the buildings rather than tiles measured inside them (section 16). It replaces nothing
in the ranking; every ranked cell clears the 30-tile floor and agrees with the zone view. Inside the
footprints, T-Mobile is healthy on 95% of headhouse tiles and 86% of Terminal C tiles. Verizon's healthy
share is lowest over B: headhouse (24% of n=173) and highest over B: Eastern Concourse (72%); AT&T's is
lowest over B: pedestrian bridges (31% of n=45). The public Terminal B record names the headhouse and the
eastern concourse cited; the measured Verizon contrast between the
Eastern Concourse (72%) and the headhouse (24%) is a question for that attestation, not a finding about
the system. Ookla's own Indoor layer is not used here (section 15).
How to read a tile map
Each tile is 0.0001° by 0.0001°, about 8 m by 11 m at 40.8° N, and is colored by the locked ladder from
the tile's aggregated RSRP over the window. A tile with no reading had no 5G sample from the Android
panel in the window. That means no measurement, not no coverage. Gate labels mark the pinned OSM gate
points.
Section 5
Tenant level
108 points · tile basis behind each category
The 108 mapped points come from an OpenStreetMap capture pinned 2026-09-15 (points only).
Category point counts sit below the 30-point floor. Category comparisons therefore run on the tile basis
behind each category's points: tiles within 80 m of any point, deduplicated. Point counts appear on every
axis.
5.1 Category signal strength and quality
Ranked categories clear the floor for every carrier: transport_admin, retail, food, services, other,
lodging. Leader by category on the tile median: transport_admin T-Mobile, retail T-Mobile, food T-Mobile,
services T-Mobile, other T-Mobile, lodging T-Mobile; trailing carrier: transport_admin AT&T, retail
Verizon, food Verizon, services Verizon, other Verizon, lodging Verizon. Read the chart as a pattern; the
point counts are small. Figs. 19 and 20 (median 5G RSRP and SINR by tenant category) ship in the PDF.
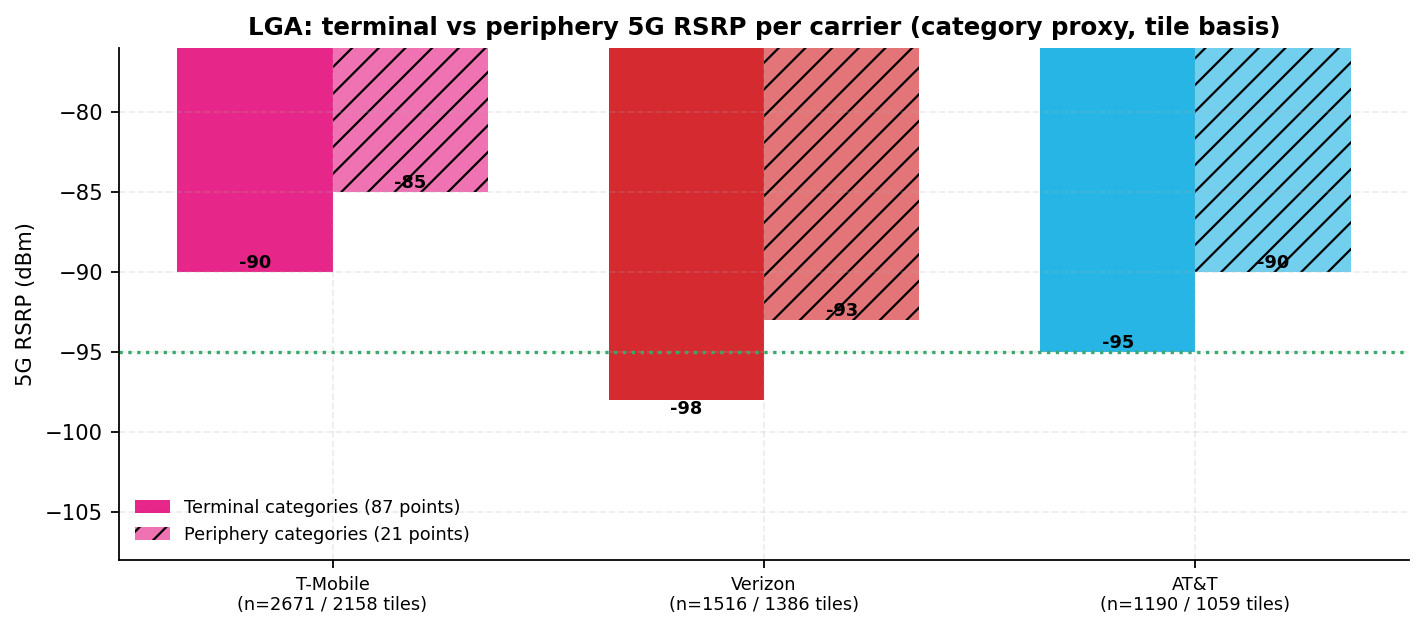
Periphery minus terminal median 5G RSRP, tile basis.
Terminal categories cover the concessions and services inside the terminal footprints; periphery
categories cover the parking structures, the hotel and lodging points, and roadside businesses. A large
positive periphery-minus-terminal delta is consistent with macro spillover. A flat or negative delta is
ambiguous between close-in macro coverage and an in-building source. Distance to macro sites confounds
both readings, and the Site Finder layer (section 15) is queued to resolve it. Deltas: T-Mobile +5.0 dB,
Verizon +5.0 dB, AT&T +5.0 dB. Tile RSRP is integer-valued, so medians and deltas quantize to whole dB.
Fig. 21 · Median 5G RSRP · terminal vs periphery tenant categoriesSource · Ookla
An airline reads its exposure through its terminal and the passenger's carrier. In this window T-Mobile
leads the Terminal B and Terminal C clusters on the tile median and the Terminal A cluster is a three-way
tie; the Verizon and AT&T order within a cluster is read from the table with the margins shown.
Terminal: airlines (transcribed)
Gates (n)
T-Mobile median 5G RSRP
Verizon median 5G RSRP
AT&T median 5G RSRP
Terminal A: Spirit Airlines
6
−98.0 dBmn=2,449
−98.0 dBmn=1,211
−98.0 dBmn=1,114
Terminal B: Air Canada, American Airlines, Frontier Airlines, JetBlue, Porter Airlines, Southwest Airlines, and United Airlines
36
−89.0 dBmn=5,437
−99.0 dBmn=3,349
−93.0 dBmn=2,611
Terminal C: Delta Air Lines (the only airline listed by PANYNJ)
38
−85.0 dBmn=3,746
−93.0 dBmn=2,212
−88.0 dBmn=1,479
Tile basis; n = tiles per carrier per terminal. Airline assignments transcribed from PANYNJ terminal pages (transcribed).
5.4 Retail and food brand coverage
Multi-location brands are a cross-zone consistency check. Point counts are small (4 at most), so this
table is a count-only view. Each point value is a mean over the tiles within 80 m of the point (per-point
tile n in Appendix A of the PDF).
Brand
Points (n)
T-Mobile median 5G RSRP
Verizon median 5G RSRP
AT&T median 5G RSRP
Hudson
1
−94.6 dBm
−98.2 dBm
−97.4 dBm
Shake Shack
1
−93.3 dBm
−98.9 dBm
−97.8 dBm
Dunkin'
4
−83.4 dBm
−96.9 dBm
−85.9 dBm
Cibo
3
−91.8 dBm
−101.0 dBm
−94.3 dBm
Junior's
1
−85.0 dBm
−101.0 dBm
−101.1 dBm
Mulberry
1
−84.7 dBm
−100.3 dBm
−98.9 dBm
Count-only view (fewer than 30 points per brand); never ranked.
5.5 Airline lounges present in the OpenStreetMap capture
3 lounge points are in the pinned capture: Centurion Lounge, Sapphire Lounge, Delta Sky Club. These are
single-point aggregates over the tiles within 80 m of each point, reported for scope and not ranked.
Lounge point
Zone
T-Mobile 5G RSRP (class, n tiles)
Verizon 5G RSRP (class, n tiles)
AT&T 5G RSRP (class, n tiles)
Centurion Lounge
Terminal B
−87.9 dBmhealthy, n=207
−98.9 dBmat-risk, n=181
−89.3 dBmhealthy, n=171
Sapphire Lounge
Terminal B
−88.3 dBmhealthy, n=201
−99.3 dBmat-risk, n=172
−89.6 dBmhealthy, n=159
Delta Sky Club
Terminal C
−82.8 dBmhealthy, n=215
−85.5 dBmhealthy, n=208
−85.8 dBmhealthy, n=201
Section 6
Load and density
Unique devices · zone level
Density is this dataset's demand signal. Ookla's User_Density field counts the unique Android devices
observed per tile over the window, deduplicated. It does not count simultaneous users and it does not
measure time spent.
Zone
Median devices per tile
p95
Usage tiles (n)
Worst carrier · below healthy
Terminal A
2
36
3,557
Three-way tieAT&T, T-Mobile, Verizon
Terminal B
4
61
7,062
Verizon · 68% of tiles
Terminal C
4
49
4,707
Verizon
Venue (on-airport)
3
n/a
16,970
n/a
User_Density = unique devices over the window, deduplicated. Tile basis. Density-weighted ranking = worst-carrier below-healthy 5G tile share × median density.
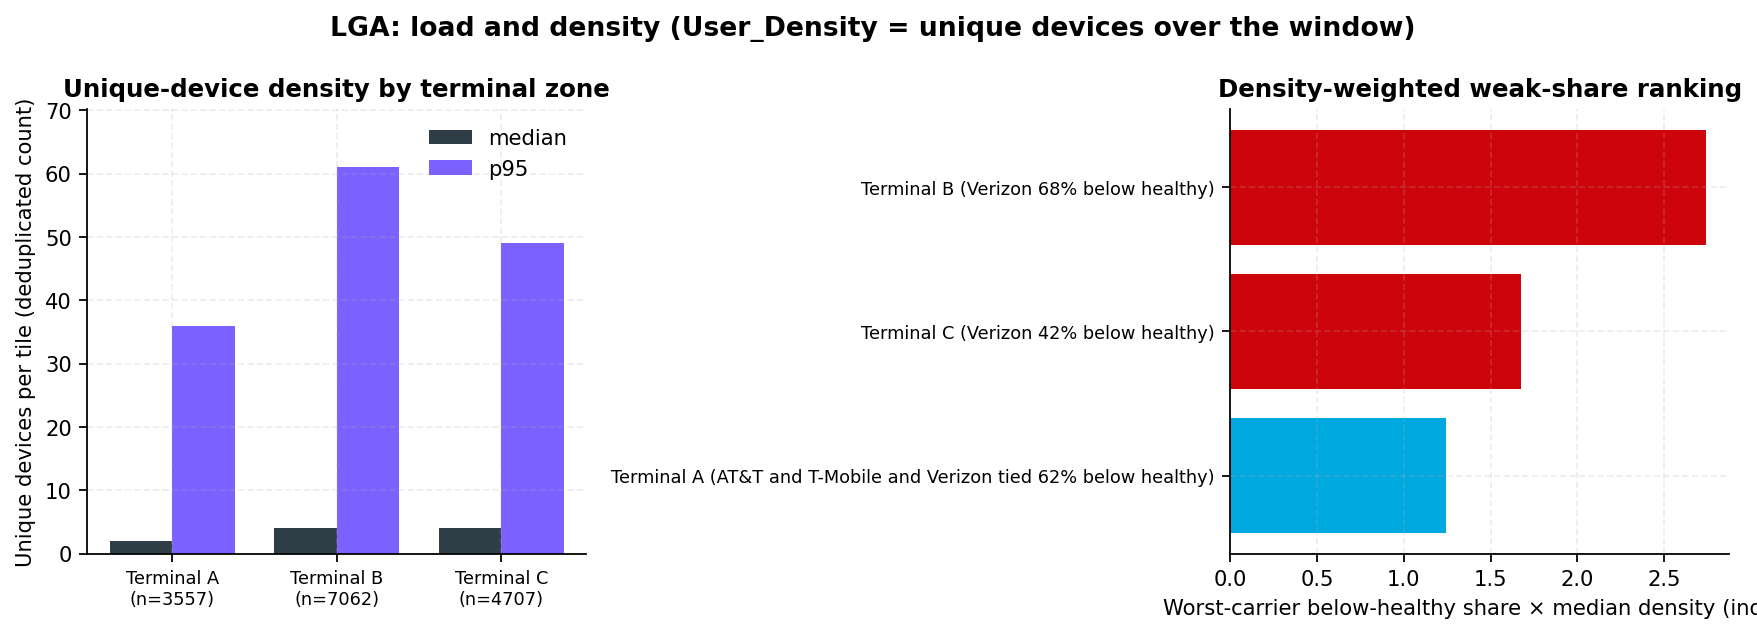
The density-weighted ranking multiplies each zone's worst-carrier below-healthy 5G tile share by its
median density, so it points to where weak signal meets the most devices. Terminal B leads the ranking
(Verizon below healthy on 68% of tiles, median density 4). The worst carrier is Verizon in Terminal B;
Verizon in Terminal C; AT&T and T-Mobile and Verizon tied in Terminal A (a below-healthy margin under
1 point is a tie).
Fig. 22 · Unique-device density by terminal zone · density-weighted weak-share rankingSource · Ookla
Median and p95 per tile; tile basis. User_Density = unique devices over the window, deduplicated. Source: Ookla Cell Analytics All Networks usage export, 2025-09-01 to 2026-08-31.
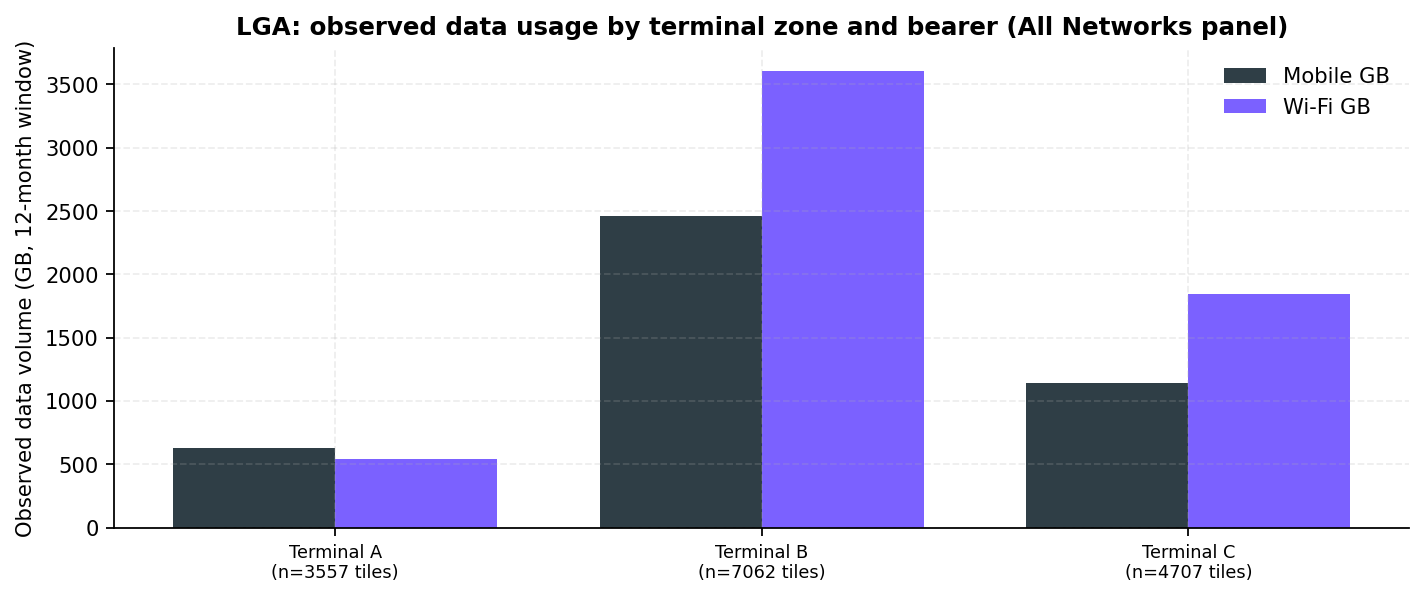
Fig. 23 · Observed data volume by terminal zone and bearerSource · Ookla
GB over the 12-month window. Source: Ookla Cell Analytics All Networks usage export, 2025-09-01 to 2026-08-31.
Usage volume shows where bandwidth is consumed, by bearer and by zone. It is observed sample volume from
the crowdsource panel. It is not total traffic.
Section 7
Wi-Fi as an augmentation layer
Venue and zone level only
Wi-Fi presence (a different figure from the offload share): Wi-Fi usage is observed on 62.1% of the
13,363 on-airport usage tiles that report the Wi-Fi field. A
non-reporting tile means no measurement and is excluded from the denominator; it is not evidence of no
Wi-Fi. The augmentation opportunity is largest where the worst-served carrier is weakest and Wi-Fi
presence is high. Fig. 24 (worst-carrier healthy share vs Wi-Fi presence by zone) ships in the PDF.
7.1 Offload share (venue and zone level only)
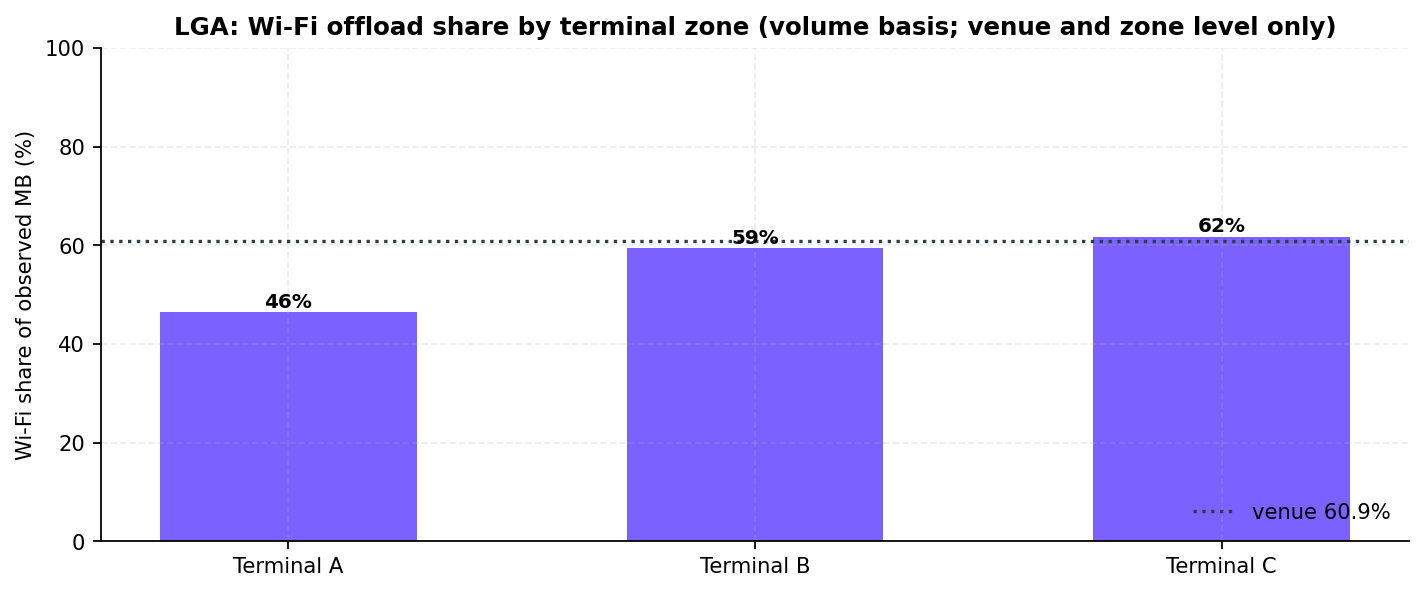
On tiles assigned to a terminal zone, 58.6% of observed data volume moves over Wi-Fi (Σ Wi-Fi MB ÷
Σ all MB on the All Networks panel, n=15,326 tiles); over the whole clip the figure is 60.9% (n=16,970).
Scope decomposition: the 1,644 usage tiles outside every zone run 81.0% Wi-Fi and lift the whole-clip
figure above the terminal-zone figure. The 200 m buffer around the aerodrome captures curbside, roadway,
and some roadside property across the Grand Central Parkway (hotel and rental lots); those are not
terminal tiles, which is why the terminal-zone figure is the one on the cover. The clip itself is
unchanged in this issue.
Fig. 25 · Wi-Fi share of observed data volume by terminal zoneSource · Ookla
Wi-Fi share of observed data volume by terminal zone, with the venue reference line. Source: Ookla Cell Analytics All Networks usage export, 2025-09-01 to 2026-08-31.
No per-carrier offload
Locked rule (section 16): offload is computed at venue and zone level only. The export does not attribute
Wi-Fi usage to any cellular carrier's subscribers, so per-carrier offload is not derivable and not
implied. The figure blends the public network with tenant, airline lounge, hotel, and personal networks.
7.2 Tenant-level Wi-Fi footprint
Wi-Fi presence and observed volume peak where passengers spend time. The public network is
_Free LGA WiFi cited; the Wi-Fi figures here come solely from the
Ookla usage layer. Controller telemetry (section 15) would convert presence into capacity. Fig. 26
(Wi-Fi observation rate and intensity across tenant categories) ships in the PDF.
Section 8
Private wireless
CBRS · operational workloads
Boingo Wireless is the Port Authority's neutral-host cellular (DAS) and Wi-Fi provider at LGA under the agreement announced October 14, 2025 (2026 to 2038, option to 2043; Boingo has operated the Port Authority's airport wireless since the 1999 New York Telecom Partners agreement); the agreement contemplates
private network infrastructure across Port Authority facilities, and no LGA-specific private LTE, 5G,
CBRS, or public-safety radio project is public cited. The one open item on
the cellular side is the Recommendation 1 attestation of which terminal buildings ride on Boingo's
network and which carriers are on the DAS in each building. The public Ookla layer does not characterize private
networks. Whether a Citizens Broadband Radio Service (CBRS) private-network layer is scoped for LGA under
the agency-wide agreement is a design question for the Port Authority and its terminal operators. On the
public-safety side, the Port Authority 2026 to 2035 Capital Plan lists LGA public-safety radio lines: PAPD
Radio Network Backhaul Infrastructure Upgrade CA02-606 ($2.5 million, design), Relocation of P25 Network
Switching Center Equipment CA02-605 ($1.5 million, construction), and Building 137 Radio Coverage
CA02-X03; no LGA-specific DAS or Wi-Fi capital line appears at FY-2026 grain
Imagine knowledge graph · cited. Typical large-hub workloads:
Workload
Why a private network fits
Coordination required
Baggage handling system instrumentation
Deterministic latency, contained RF, isolation from passenger traffic
Terminal operators, baggage system vendors
Ramp and ground-service vehicle telematics
Outdoor airside coverage with controlled SIM provisioning
Airside operations
Push-to-talk and operational voice
Guaranteed-quality voice independent of public carriers
Port Authority Police, ground handlers
Fixed cameras and IoT in non-public areas
Bandwidth without consuming public-carrier capacity
Facilities maintenance
Construction-phase connectivity (Marine Air Terminal rebuild)
Coverage that survives demolition and rebuild sequencing
Program management, contractors
Section 9
Spectrum and service availability
Bands · availability
9.1 Band distribution
Legend: Ookla band labels are technology plus approximate frequency in MHz, printed verbatim from the
export. For example, NR2500 and NR2600 are both 2.5 GHz spectrum, and LTE800 and NR850 are both 850 MHz
cellular spectrum. LTE700PS is FirstNet Band 14, the public-safety broadband band. Cell, PCI, and band
fields populate only where Ookla resolved a serving cell, so band n is smaller than RSRP n (section 16).
The bands a tile attaches to most often show which spectrum each carrier puts to work at the venue.
Sub-1 GHz attachment implies coverage-grade bands. Mid-band attachment implies strong penetration or an
in-building source. AT&T's 5G band mix rests on 319 cell-resolved tiles and is not representative of its
5,687 5G-reporting tiles. LTE1800 rows are an Ookla band label as exported, not a United States band
allocation. Fig. 27 (strongest-serving band distribution per carrier) ships in the PDF.
Carrier
5G NR strongest band · tiles (n) · share of NR footprint
LTE strongest band · tiles (n) · share of LTE footprint
Labels are Ookla's, printed verbatim. Share = band tiles ÷ the carrier's band-reporting tile footprint (PDF Appendix B).
9.2 Service availability
On reporting tiles, all three carriers show near-universal LTE service availability, the
graceful-degradation floor. Basis disclosure: availability fields are not populated on every tile
(general-LTE reporting share: T-Mobile 86%, Verizon 84%, AT&T 80%). The mean is over reporting tiles only.
Fig. 28 (own-network and general-LTE availability; the general-service field reads 100% for every carrier
and is not drawn) ships in the PDF.
Section 10
Carrier-asymmetry atlas
Worst-carrier tally per gate
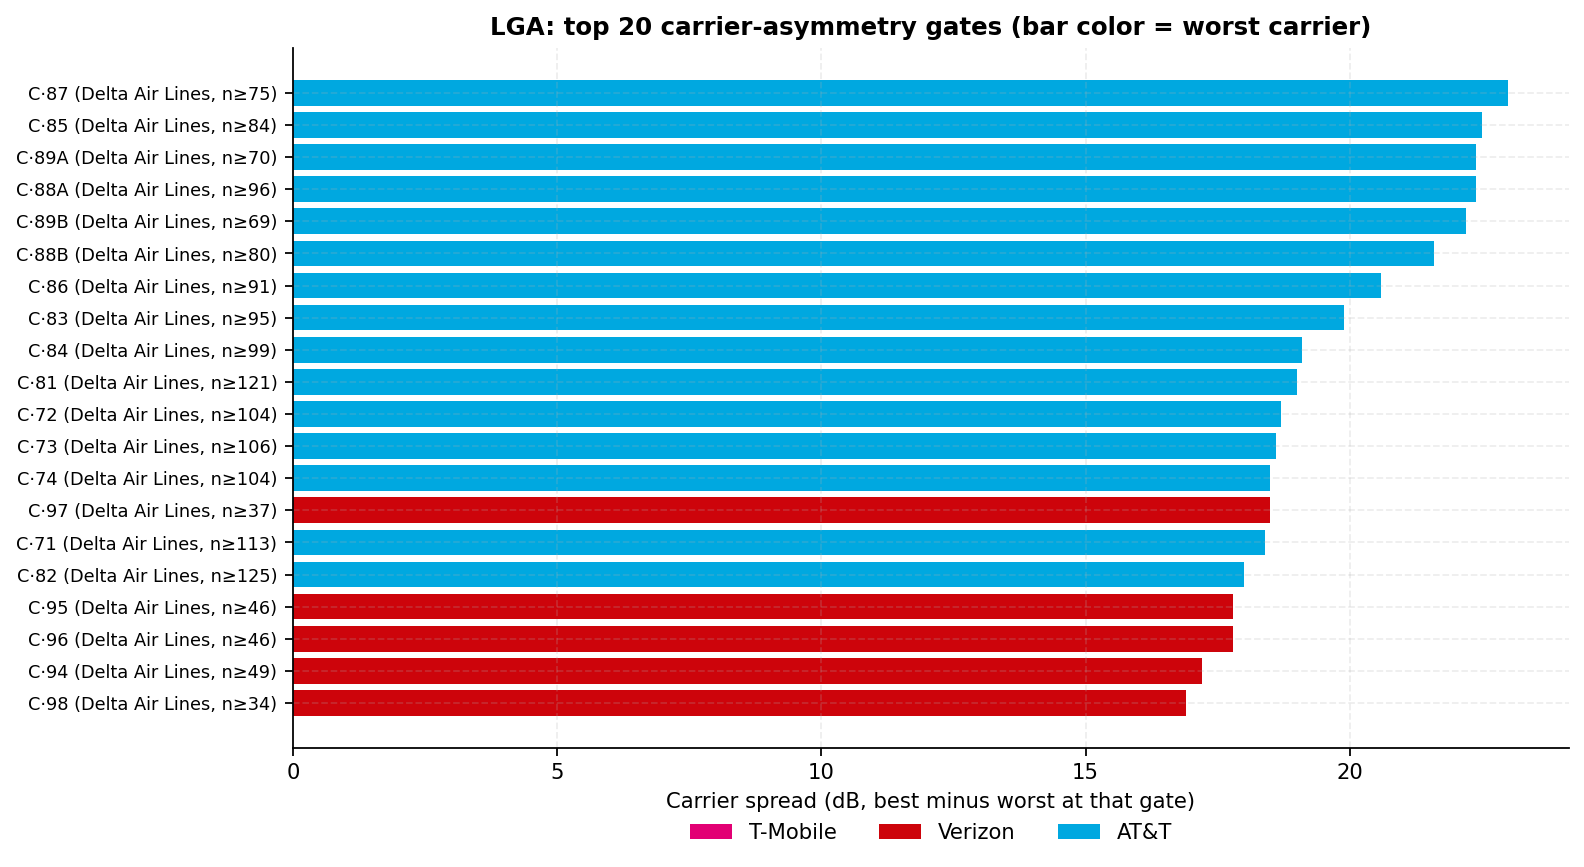
The top 20 gates by best-minus-worst carrier 5G RSRP spread are where a passenger's experience varies
most by carrier (spreads of 17 to 23 dB). The best carrier at every one of the top 20 is T-Mobile.
Worst-carrier tally across all 80 ranked gates: Verizon 41, AT&T 35, T-Mobile 4. The top five sit
in Terminal C (5): gates 87, 85, 89A, 88A, 89B. They serve two purposes: worst-case examples for the
stakeholder narrative, and the validation-point list for post-deployment monitoring (section 14). Verizon
and AT&T 5G on an in-building path should compress this spread.
Gate (OSM ref)
Terminal · airline (transcribed)
Best carrier
Worst carrier this window
Spread this window
C·87
Terminal C · Delta Air Lines
T-Mobile
AT&T
23 dB
C·85
Terminal C · Delta Air Lines
T-Mobile
AT&T
22 dB
C·89A
Terminal C · Delta Air Lines
T-Mobile
AT&T
22 dB
C·88A
Terminal C · Delta Air Lines
T-Mobile
AT&T
22 dB
C·89B
Terminal C · Delta Air Lines
T-Mobile
AT&T
22 dB
Spread = best minus worst carrier mean 5G RSRP at the gate, as printed in the section 14 criteria. Every published pair n ≥ 30 tiles; 0 gates sub-floor.
Fig. 29 · Carrier-asymmetry atlas · top 20 gates by spreadSource · Ookla
Among the 80 gates where every carrier's per-gate n is at least 30 tiles. Bar color is the worst carrier at that gate. Gate refs follow the OpenStreetMap inventory. Source: Ookla Cell Analytics per-carrier RF tile export, 2025-09-01 to 2026-08-31.
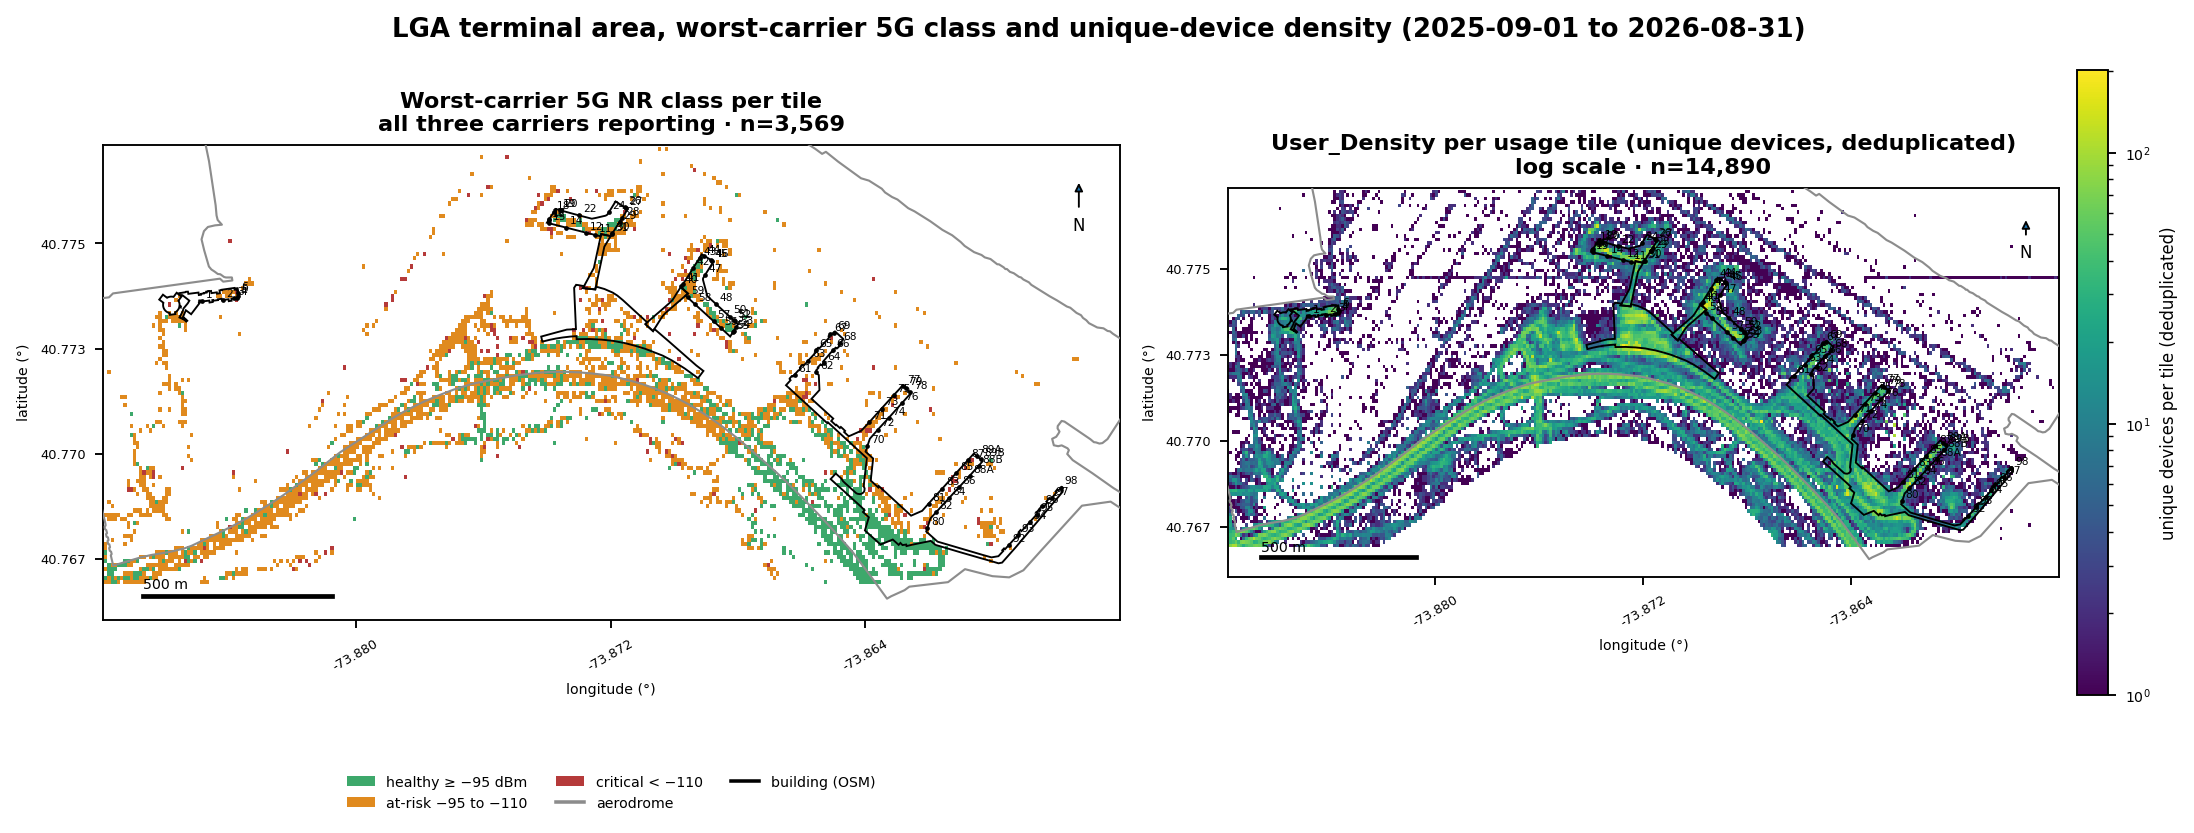
Fig. 30 · Worst-carrier 5G class per tile and unique-device density per tileSource · Ookla
Left: each terminal-area tile colored by the worst carrier's 5G NR class where all three carriers report. Right: User_Density per usage tile (unique devices, deduplicated) on a log scale over the same extent. Source: Ookla Cell Analytics per-carrier RF tile export and All Networks usage export, 2025-09-01 to 2026-08-31.
Fig. 30 pairs the two questions an operator asks first: where is the weakest carrier weak, and where
are the devices. Amber covers the Terminal B headhouse, the Terminal C piers, and the roadway loop, and the
density panel shows the terminal frontages and the roadway carrying the highest unique-device counts.
Section 11
Federal and operational-critical tenants
Single-point aggregates · scope only
1 operational-critical point is identifiable by name in the pinned capture (Port Authority Police); no
other federal or operational-critical point is identifiable by name in the capture. AT&T's FirstNet
Band 14 (LTE700PS) appears on
280 AT&T LTE tiles (section 9.1); public-safety coverage posture is a section 15 layer. These readings are
single-point aggregates, reported for scope and not ranked.
Translation method: LGA recorded 16,715,567 revenue enplanements in calendar 2024 (FAA
cited) and 32,800,000 total passengers in 2025 (Port Authority, both
directions cited); the two bases are not interchangeable and only the
FAA enplanement figure belongs in any translation. Per-gate volumes are not available, so the only translation
this report offers is illustrative and stays in prose: distributing annual enplanements uniformly across
the 80 measured gates (including the six Terminal A gates that closed in May 2026) would place the share
of gates below healthy 5G onto the same share of enplanements.
Carrier
Gates below healthy 5G
Share of gates
Gates within 1 dB of the line (sensitivity)
T-Mobile
24 of 80
30.0%
14
Verizon
74 of 80
92.5%
11
AT&T
66 of 80
82.5%
11
Illustrative proxy, kept in prose
It is not a measurement, it assigns every gate the same volume regardless of airline, and it is
not tabulated for that reason. A gate-level passenger feed (section 15) would replace it. The point
stands without it: on Verizon and AT&T, 92.5% and 82.5% of gates sit below the healthy 5G threshold in
this window, with 11 and 11 of those gates within 1 dB of the line.
Section 13
Prioritized recommendations
Ordered by dependency · each with an owner
Attest the in-building inventory
Which terminal buildings ride on Boingo's network and which carriers are on the DAS in each building
is not held; the owners named here hold that inventory between them and should attest it. The
measured pattern (Verizon and AT&T LTE healthy at 77 and 75 of 80 gates; their 5G NR healthy at 6 and
14) is consistent with more than one explanation, and the answer decides the design.
Owner · Port Authority of New York and New Jersey with LaGuardia Gateway Partners, Delta Air Lines, and Boingo Wireless
Bring Verizon and AT&T 5G NR onto Boingo's in-building systems, headhouse and Terminal C first
Subject to the Recommendation 1 attestation. Acceptance is the per-carrier commissioning KPI set (walk
test and scanner survey); section 14 stays a monitoring plan and is not written into the scope of work.
Owner · Boingo Wireless with Verizon and AT&T; LaGuardia Gateway Partners; Delta Air Lines
Treat the Marine Air Terminal rebuild as the acceptance zone
The capital plan funds a rebuild of the non-landmarked gate areas; specify multi-carrier 5G NR
in-building coverage in the design and adopt the section 14 at-reopening criteria before the first
tenant returns.
Owner · Port Authority of New York and New Jersey
Treat Wi-Fi as a coexisting capacity layer in the design
Terminal-zone offload 59%, section 7.1. Obtain controller telemetry for the public network to size it.
Owner · Port Authority of New York and New Jersey, Boingo Wireless
Decide the CBRS and private-wireless question under the agency-wide agreement alongside the 5G NR work
Decide it alongside the 5G NR work (section 8), not after it.
Owner · Port Authority of New York and New Jersey
Section 14
Post-deployment monitoring criteria and re-measurement plan
Before-and-after · locked ladder
These are monitoring criteria for the before-and-after comparison, not the acceptance test for any
system. Acceptance itself is per-carrier commissioning (walk test and scanner survey) against the same
thresholds. Thresholds are the locked ladder (section 16). Gate refs and counts come from the OpenStreetMap
inventory (Terminal A 6, Terminal B 36, Terminal C 38; the Port Authority publishes 35 gates at Terminal B
and 37 to 38 at Terminal C). Gate-named criteria must be reconciled against the operators' gate plans
before adoption.
Zone or point
Carrier
Criterion (threshold)
Re-test
All measured gates
Every hosted carrier
5G SS-RSRP median ≥ −95 dBm per gate
Like-for-like window after go-live
All measured gates
Verizon
Healthy 5G at ≥ 90% of gates (this window: 6 of 80, 8%)
Like-for-like window after go-live
Terminal B
Verizon
Healthy 5G on ≥ 90% of zone tiles (this window: 32%, n=3,349)
Like-for-like window after go-live
Terminal C
Verizon
Healthy 5G on ≥ 90% of zone tiles (this window: 58%, n=2,212)
Like-for-like window after go-live
Terminal A (rebuilt gate-area footprint)
Verizon
At reopening: healthy 5G on ≥ 90% of tiles inside the rebuilt gate-area building footprint (this window's footprint: 25 5G-reporting tiles, below the 30-tile floor, a count only; the 1,211-tile Terminal A zone includes parking and roadway and is not the criterion)
First like-for-like window after the rebuilt gate areas reopen
All measured gates
AT&T
Healthy 5G at ≥ 90% of gates (this window: 14 of 80, 18%)
Like-for-like window after go-live
Terminal B
AT&T
Healthy 5G on ≥ 90% of zone tiles (this window: 58%, n=2,611)
Like-for-like window after go-live
Terminal C
AT&T
Healthy 5G on ≥ 90% of zone tiles (this window: 70%, n=1,479)
Like-for-like window after go-live
Terminal A (rebuilt gate-area footprint)
AT&T
At reopening: healthy 5G on ≥ 90% of tiles inside the rebuilt gate-area building footprint (this window's footprint: 24 5G-reporting tiles, below the 30-tile floor, a count only; the 1,114-tile Terminal A zone includes parking and roadway and is not the criterion)
First like-for-like window after the rebuilt gate areas reopen
Terminal A
T-Mobile
Hold parity: healthy 5G on ≥ 39% of zone tiles (this window's share in this zone, n=2,449)
Like-for-like window after go-live (at reopening for Terminal A)
Terminal B
T-Mobile
Hold parity: healthy 5G on ≥ 71% of zone tiles (this window's share in this zone, n=5,437)
Like-for-like window after go-live
Terminal C
T-Mobile
Hold parity: healthy 5G on ≥ 83% of zone tiles (this window's share in this zone, n=3,746)
Like-for-like window after go-live
Terminals B and C
T-Mobile
LTE tile median ≥ −95 dBm per zone (this window: B −93.0 dBm, n=4,472; C −87.0 dBm, n=2,536)
Like-for-like window after go-live
Gate C·87 (OSM ref)
worst this window: AT&T
Best-minus-worst carrier spread ≤ 10 dB (this window 23 dB)
Like-for-like window after go-live
Gate C·85 (OSM ref)
worst this window: AT&T
Best-minus-worst carrier spread ≤ 10 dB (this window 22 dB)
Like-for-like window after go-live
Gate C·89A (OSM ref)
worst this window: AT&T
Best-minus-worst carrier spread ≤ 10 dB (this window 22 dB)
Like-for-like window after go-live
Gate C·88A (OSM ref)
worst this window: AT&T
Best-minus-worst carrier spread ≤ 10 dB (this window 22 dB)
Like-for-like window after go-live
Gate C·89B (OSM ref)
worst this window: AT&T
Best-minus-worst carrier spread ≤ 10 dB (this window 22 dB)
Like-for-like window after go-live
Re-measurement uses the same instrument as this baseline (Ookla Cell Analytics, identical thresholds).
The window is like for like: the same 12-month length, or a matched shorter window that is disclosed
alongside the result. Ookla's date-range comparison renders the before and after directly. Imagine
Wireless re-measures over that window after any in-building change goes live; the crowdsourced tiles
serve as the before-and-after comparison and acceptance itself is per-carrier commissioning.
Section 15
Next layers to add
Queued for the next revision
Layer
What it resolves
Source
Ookla Site Finder centroids (LTE and 5G)
Macro-site geometry behind the section 3 and 5.2 readings; this issue publishes no site figure, so those readings rest on the RF tiles alone; queued for the next issue
Ookla portal pull (Imagine Wireless)
In-building inventory attestation
Which carriers and bands each Terminal B, Terminal C, and Marine Air Terminal system carries (Recommendation 1)
Port Authority, terminal operators, Boingo Wireless
Google Places tenant capture
Adds admin, services, and lounge points to the OpenStreetMap list and thickens the category cells
Google Places (New) pull (Imagine Wireless)
Indoor mask
OSM building-polygon mask shipped in this issue (section 4.7); Ookla native Indoor layer to be pinned as portal captures
Ookla portal captures (Imagine Wireless)
Date-range comparison
Before and after for any in-building change; converts this snapshot into a trend
Ookla portal pull
Poor multi-network coverage
Vendor-ranked building-versus-carrier problem split; corroborates section 4.3
Ookla portal pull
3D Z-axis view
15 m vertical bands; the export is flat but the portal is not
Ookla portal pull
Per-gate passenger counts
Replaces the section 12 uniform-distribution proxy with measured exposure
Port Authority, terminal operators, airline schedules
Gate plan reconciliation
Aligns OpenStreetMap gate refs with the operators' gate lists before gate-named criteria are adopted
LaGuardia Gateway Partners, Delta Air Lines
Marine Air Terminal rebuild design documents
Zones, hosted carriers, and commissioning criteria for the section 14 at-reopening plan
Port Authority
Wi-Fi controller telemetry
Airtime, retries, client density; converts presence into capacity
Boingo Wireless, Port Authority
Deployment, vendor, contract, and leadership records for LGA
Not available at this issue; every entity statement here cites a public source
Imagine Wireless research file
Public-safety (NFPA 1221) coverage
Emergency responder radio coverage posture; FirstNet Band 14 is present in the data
Authority having jurisdiction, integrator; Port Authority 2026 to 2035 Capital Plan lines CA02-606, CA02-605, CA02-X03 Imagine knowledge graph · cited
Published speed benchmark
Ookla's published Speedtest Intelligence 1H 2025 airport benchmark reports LGA mobile median downloads of T-Mobile 225.54, Verizon 193.65, and AT&T 161.96 Mbps and airport Wi-Fi 165.74 Mbps Imagine knowledge graph · cited; a different instrument and panel from this report's tiles, which carry no throughput
Ookla public article via the knowledge graph
Walk test: jet bridges, baggage corridors, construction zones
Areas crowdsource cannot reach; the acceptance instrument
Scanner survey
Section 16
Method, thresholds, confidence, and caveats
Thresholds · provenance · reproducibility
Rule
Value
Measurement source
Ookla Cell Analytics per-carrier RF tile exports and the All Networks usage export for LGA, 12-month window 2025-09-01 through 2026-08-31, clipped to the KLGA aerodrome polygon (OpenStreetMap way 198597589) plus a 200 m buffer, intersected with the export rectangle common to all four files (latitude 40.7669 to 40.784, longitude -73.8902 to -73.8552; the Verizon export was drawn on a wider rectangle that fully contains it, so every carrier shares one footprint). 34,844 on-airport RF tiles are retained from 67,926 exported; 16,970 usage tiles from 19,221. The aerodrome's northern apron and Runway 4/22 end and its far western edge lie outside the common rectangle and hold no tiles; no terminal is affected.
Tile geometry and sample basis
Each RF tile is 0.0001° by 0.0001°, about 8 m by 11 m at 40.8° N. The three carrier panels cover 17,135 unique tile centroids on the airport, 6,912 of them seen by all three carriers. The export carries no per-tile scan count, so every n in this report counts tiles, not scans. The 30-tile floor guards spatial support, not scan volume. Ookla aggregates each tile from its panel over the window.
Joins and zones
Tiles to gate and tenant points within an 80 m radius. Gates and gate refs come from a pinned OpenStreetMap inventory (80 gates: Terminal A 6, Terminal B 36, Terminal C 38; refs are bare numbers, zoned by point-in-polygon against the pinned terminal footprints with a 150 m nearest-footprint fallback; the Port Authority publishes 35 gates at Terminal B and 37 to 38 at Terminal C), so gate-named criteria must be reconciled against the operators' gate plans before adoption. Tenants come from a pinned OpenStreetMap capture (108 points, no polygons, no Z-axis). Tile-to-zone assignment: nearest gate or tenant point within 500 m (disclosed proxy). Tenant zone attribution: point-in-polygon against the same footprints, then the nearest gate's zone within 400 m, so points across the Grand Central Parkway can be attributed to Terminal B through that fallback (disclosed proxy).
Building mask and maps
Building mask (section 4.7): point-in-polygon of tile centroids against the pinned OSM footprints, so it selects tiles over a building, not tiles measured inside it. Maps: equirectangular axes in degrees, north up, no basemap tiles, rebuilt from the pinned CSVs.
Central tendency and carrier order
Median for every headline figure; means only where labeled. Carrier mapping: the export's T-Mobile US, Verizon, and AT&T US operators are printed as T-Mobile, Verizon, and AT&T. Carrier ordering throughout: strongest at the gates first (T-Mobile, then Verizon and AT&T, which are tied), asserted against the data at build time.
Threshold ladder (locked)
5G NR SS-RSRP and LTE RSRP healthy ≥ −95 dBm, at risk −95 to −110, critical < −110. 5G SS-SINR healthy ≥ 10 dB, at risk 0 to 10, critical < 0. RSRQ healthy ≥ −10 dB. No venue-specified threshold was provided. Noise floor: margins under 1 dB are not rankings; every rank statement in this report prints its margin, and the Verizon-to-AT&T gate-median margin of 0.3 dB is reported as a tie.
Minimum-sample rule
No chart or comparative claim ships on fewer than 30 underlying tiles or points. Terminal A holds 6 gates and every tenant category fewer than 30 points, so those tallies appear as counts with n visible and are not ranked; Terminals B and C clear the gate floor and their gate shares are printed as percentages; zone and category comparisons run on the tile basis for one consistent basis.
Units rule
Ookla User_Density is the count of unique Android devices observed per tile over the measurement window, deduplicated. It does not count simultaneous users and it does not measure time spent, and neither reading appears anywhere in this report. Wi-Fi offload = Σ Wi-Fi MB ÷ Σ (Wi-Fi + Mobile) MB by volume, computed at venue and zone level only on the All Networks panel. Per-carrier offload is not derivable from this dataset and is not implied. The offload figure cannot separate the public network from tenant or personal networks.
Sample basis and inference limits
Crowdsourced background scans from consumer Android handsets (a panel Ookla characterizes as about 3% of devices; iOS devices are not sampled), aggregated per tile over 12 months. The panel's composition differs by carrier, so cross-carrier comparisons inherit a device-population bias this export cannot correct. Supported: medians, shares, and distributions at venue, zone, gate-cluster, and tenant-category level with n disclosed. Not supported: throughput, latency, or jitter (not in this export), per-carrier Wi-Fi offload, sub-tile positioning, and floor separation. Nothing in this report is measured indoors: there is no indoor mask beyond the building-polygon selection and no Z-axis, and gate values are tiles within 80 m of a point that can straddle the apron. The Terminal A window blends eight months of scheduled operation with four months of closure.
Window and freshness
2025-09-01 to 2026-08-31 · issued 2026-09-15 · 15 days at issue, within the 90-day policy.
Confidence tagging
Facts sourced from public records rather than measurement are tagged "cited" inline; a cited fact is not independently verified and is never a measurement. Measured claims reproduce from the raw exports through the audit dossier that accompanies this report, which also records capture dates for transcribed values (terminal operators and airline assignments) and the public source behind every entity statement. Facts from the Imagine knowledge graph are pinned in the build's source folder and tagged "Imagine knowledge graph" inline; the graph's contracts query was not available at this issue and its leadership rows are held, not published. The 90-day freshness policy is Imagine Wireless's reporting policy.
Population key
For the several n printed for one carrier: all on-airport tiles (T-Mobile 14,024, Verizon 11,138, AT&T 9,682); tiles inside the terminal extent drawn on the maps (T-Mobile 12,608, Verizon 10,127, AT&T 8,880); 5G-reporting tiles (T-Mobile 12,733, Verizon 7,535, AT&T 5,687); 5G-reporting tiles inside the map extent (T-Mobile 11,638, Verizon 6,954, AT&T 5,301). Cell, PCI, and band fields are smaller still (field population table below).
Caveats
The dataset is gate-area and public-corridor weighted; it does not cover jet-bridge interiors or baggage corridors. PCI diversity, serving-cell volatility, and band distributions are aggregate proxies, not active traces or carrier network-management data. The optimization priority index is Ookla's vendor-defined layer, reported as such. Engineering inferences about cause are labeled as inferences where they appear.
Provenance discipline
Every numerical value in this report is computed from the cited source files at build time or is attributed inline to the Imagine knowledge graph. No value is estimated or invented. Photographs are illustrative material from Wikimedia Commons under the licenses listed in the audit dossier and in each caption; they are not measurements.
Field population
Cell, PCI, and band fields populate only where Ookla resolved a serving cell, so their n is smaller than
the RSRP n for the same carrier. The table shows the number of on-airport tiles that populate each field.
Field
T-Mobile
Verizon
AT&T
NR_SS_RSRP
12,733
7,535
5,687
NR_Strongest_Cell
12,119
4,252
319
NR_Strongest_PCI
12,120
4,253
319
NR_Strongest_Band
12,120
4,253
319
LTE_RSRP
9,721
9,849
9,274
LTE_Strongest_Cell
9,727
9,852
9,276
LTE_CQI
2,859
4,289
3,461
Optimization_Priority
8,220
9,001
8,302
General_LTE_Service
12,033
9,383
7,721
All on-airport tiles
14,024
11,138
9,682
Provenance tag legend
Tag
Meaning
cited
A fact from a public record (Port Authority releases and terminal pages, vendor and design-firm records, FAA statistics, press), never a measurement. It may corroborate a measured finding and never originates one.
Imagine knowledge graph
A fact from the Imagine knowledge graph, pinned in the build's source folder. Where it is also a public-record fact it carries "cited" as well. The graph's contracts query was not available at this issue and its leadership rows are held, not published.
transcribed
Transcribed values with a capture date recorded in the audit dossier: terminal operators and airline assignments, the OpenStreetMap gate and tenant capture (pinned 2026-09-15), and every photograph.
Untagged numbers
Measured. Computed from the Ookla exports at build time and reproducible from the raw exports through the audit dossier that accompanies this report.
Photo credits
Photograph
Author
License
Date
Terminal B Level 3 check-in hall
Silver Dovelet
CC BY-SA 4.0
2025-10-19
Terminal C concourse from the apron at night
DiscoA340
CC BY-SA 4.0
2023-10-18
FAA airport diagram for LGA
Federal Aviation Administration
Public domain
2025-01-01
Terminal B food hall
Jim.henderson
CC BY-SA 4.0
2024-10-01
Terminal C apron side at gate 86
Nielsoncaetanosalmeron
CC BY 4.0
2025-09-02
Terminal C gate 89A hold room
DiscoA340
CC BY-SA 4.0
2023-10-18
Terminal C concourse at the Delta gates 70 to 79
Myotus
CC0
2024-05-03
The Marine Air Terminal
Epicgenius
CC BY-SA 4.0
2025-11-08
All photographs via Wikimedia Commons; used unmodified except for resizing. Photographs are illustrative material and are not measurements.
Audit trail
Every measured value on this page is transcribed from the rev-1 report, whose numbers compute from the
pinned Ookla exports at build time and reproduce through the verification bundle. The audit dossier
(lane-tagged claims ledger, methodology, provenance manifest, findings log) ships with the bundle.
Deliverable subject to the two-lane human review gate; sign-off status accompanies this issue.